
How to Identify Trend Reversal Point and how it is different from identifying the end of bull market and bear markets.
Which is More Effective – Technical Analysis or Fundamental Analysis?
Fundamental analysis is the study of the underlying business and its growth prospects. Technical Analysis is the study of the reaction of the market participants (traders, investors or speculators) to a certain chain of events. So which one is more effective and when?
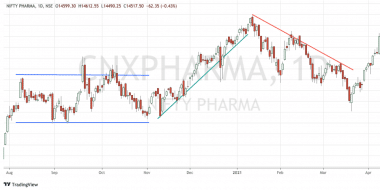
How To Use Channel Breakout Chart Pattern To Trade At the Right Time
Understand channel breakout pattern with a chart of Nifty from July 2016 to September 2016 and calculate stop loss, target, risk reward ratio and no trade zone.
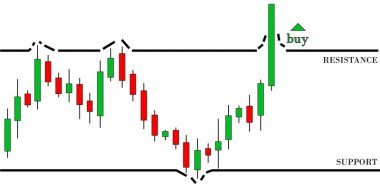
How to Trade in Market With Breakout Chart Pattern?
Breakout Chart Pattern is my favorite pattern for trading in market and this time it was not only me who made tons of money with this pattern but forum members also took the most out of this pattern.
Technical Analysis of Indian Mutual Funds
There is no Open, High, Low, Close values for mutual fund NAV and so you cannot have candle sticks but still can apply the price action chart patterns on mutual fund NAV for technical analysis.
Making Most of Technical Analysis Indicators
Guest Post by Kotak securities where they shares some of the key takeaways for investors and traders when using technical indicators like MACD, RSI or Stochastic.
Technical Analysis Forum
Technical Analysis Forum to discuss stocks, technical’s, investments as well as ways to make forum a better place for everybody to learn and share the art of trading and investing in market.
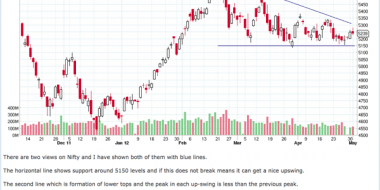
When to Short A Stock – Intraday Shorting Strategy Revealed
My intraday shorting strategy to understand when to short a stock with Morning Panic and Afternoon Fade chart pattern using chart of Infosys on Friday the 13th
10 Articles to Understand Price Action Strategy and Improve Technical Analysis
Articles from my blog archive to make a collection of Free Technical Analysis Tutorials.
Technical Analysis, Fundamental Analysis Or Both – When to Choose What?
What kind of Investors use Technical Analysis and What Kind of Investors use Fundamental Analysis? Though I am more inclined towards technical analysis I will try to answer this question from a neutral point of view.
What is the Best Way to Learn Technical Analysis?
What is the best way to learn technical analysis? I will answer this question in a very short and simple one liner which is …