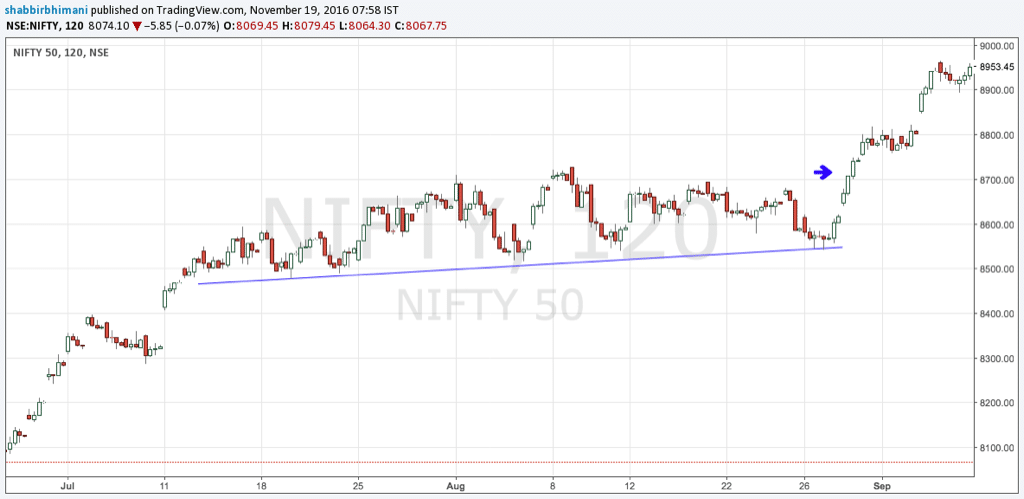
Understand channel breakout pattern with a chart of Nifty from July 2016 to September 2016 and calculate stop loss, target, risk reward ratio and no trade zone.
Stock market gurus look at any stock are able to provide instant stop loss and target levels for it. A retail investor can do the same.
Let me share one of my favorite pattern that I use for trading that has a sure shot way to make money from the market and has a success ratio of more than 70%.
The pattern is breakout pattern.
What is the Breakout Pattern?
There are many forms of breakout pattern but the one that we are going to discuss here is a channel breakout pattern where the price movement was confined within a particular range for a period of time and has not given any move in either direction.
Let us look at 2 hours chart of Nifty from July to September 2016.
The blue line is the support trend line which is to predict support levels and blue arrow is when breakout happens.
Stop Loss
The stop loss for long trade is the previous low or decisive levels near the previous low.
In the above chart, it can be anything from 8520 to 8480 levels depending on which low is used as a reference. You can use the last low or the first low.
Support levels also vary from expert to expert depending on what he sees as decisive low to keep a stop.
Target
Once a breakout occurs from an existing price channel, prices usually travel a distance equal to the width of the channel.
Breakout above 8700 with a stop of 8500 (or 8550 the last low) means the move will be at least 200 points on the upside from 8700. We have already seen Nifty moved upto 8900+ after the breakout above 8700.
Risk Reward Ratio
The most important part of the puzzle is risk reward ratio. In very simple terms, it is a ratio of the amount a trader is ready to lose when the stop loss is hit to the amount of gain can be achieved when the target is hit.
For each trade, the amount lost when it hits a stop loss should always be less than the gains when it hits a target.
No Trade Zone
If there a major resistance between the target price and the breakout price, it is a no trade zone.
In the above chart, let us assume a major resistance is at 8800. A long position above the breakout of 8700 with a stop loss of 8550 and a target of 8850 is not recommended because 8800 resistance will be a major hurdle to cross for target to be achieved. So the breakout above 8700 is a no trade zone with a stop of 8550.
FAQ’s
What if everyone buys at breakout?
Everyone will not enter the market at the same time and at the same price because there are many forms of breakout and channel breakout is one of them.
The more experienced of traders use anticipated breakout where they buy in dips to reduce the stop loss and make the ROI ratio more lucrative.
On top of it, some are trading for the breakout but others are day traders in the breakout or are using a different time frame to view a different breakout levels. So the possibility of all technical analyst acting the same way at the same time is quite less.
What happens if we are long around 8th Aug at fake breakout?
Stop loss is a savior for fake setups all the time. The prior low of 8520 becomes the stop for the position and hold.
All trade setups either hit a stop loss or hit the target and in this case, ideally the stop loss is not hit and ultimately there is a breakout.
Over to you
Do you use a breakout pattern for trading? If yes let us know how you use it so we can learn something from it. If not what other patterns do you use for trading? Share them in comments below.
PS: I use TradingView for all my charts and technical analysis.


Sir, can you guide me for mutual fund distributor exam ?