I saw one of my favourite chart pattern (break out chart pattern) formations that helped me make two thousand bucks in a matter of few minutes. I will tell you how you can also do the same.
Monday is one of the most busiest day for me not only because I send weekly updates for shabbir.in but because of my other blog IMTips and forums like Go4Expert, MBAGuys and many other. It is one such day where trading almost takes the back seat and I hardly have the time to trade, still when I am in front of my PC with terminal open in the background, if I manage to find stocks where I am 100% sure of making some quick bucks I don’t resist myself doing the trades and today was no difference. I saw one of my favourite chart pattern (break out chart pattern) formations that helped me make two thousand bucks in a matter of few minutes. I will tell you how you can also do the same.
First let me show you the trade details for today.
I saw 2 major signals before the trade
- Formation of morning spike and breakout pattern [Reference Chapter 6*]
- Good breakout on good volumes [Reference Chapter 10*]
* References are from my book – Understanding Chart Pattern.
Those who still don’t have my book, I will try to explain them to the extent I can here but chapters 6 and 10 combined are more than 15 pages in my book. I am not sure if I can manage to get all of it in this one single post.
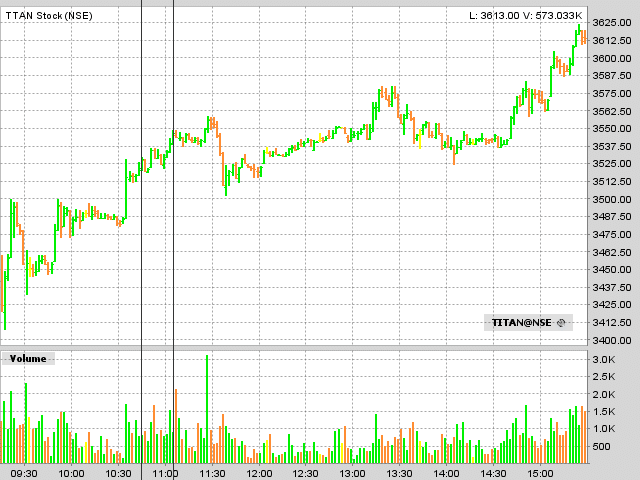
Let us see the chart for Titan Industries first. The vertical black lines are when I made the trades.
You can see that Titan was one of those few stocks that were positive in the market opening and it spiked to 3500 in the opening trade. Few minutes and it again touched 3500 clearly a morning top was formed. Now all I have to do is waiting for 3500 to breakout decisively with increasingly good volumes. Once I saw the same I was certain I can make few thousands very easily.
Do you understand the charts of the stock you are investing into? If your answer is No it is time to start Understanding chart patterns.


Hi!
Is it possible to find out breakout point using LINE CHART?? If possible will you please send me the examples on the above email address.
Thanks and Regards
Mayur
No Mayur, with line charts it is not possible to understand the breakouts
Hi Shabbir,
Could you please tell which application/site did you use to take snapshot shown above for Titan.
Thanks
It is from interactive broker’s trader workstation application
I have a question here..
So you mean to say doing extensive intra-day trading with Breakout chart can earn some thousands bucks. Does this not promote gambling(Playing with the money) instead of investing??
No I don’t think it is gambling because you are just investing for a very short time span in real companies.
I have a web site where I research stocks under five dollars. I have always been a fundalmentalist when it comes to stock investing. I do not believe that you can predict short term price movements in stocks long term price movements is another matter all together. I know from my experiences that when a stock is badly over sold this is a anomaly in so instances. If you buy a very under valued stock with stong fundalmentals this is often a great opportunity to profit from these anomalies.
James I think you should use Tim Sykes as well and I do follow him.