For longer-term investment fundamental analysis is preferred over technical analysis but see how I use technical analysis for longer-term investments to find the right time to invest in the right stock and at the right price.
For longer-term investment (more than 3 years), fundamental analysis is preferred over technical analysis but technical analysis can also be used for longer-term investments. Let me try to explain how I use technical analysis for longer-term investments to find the right time to invest in the right stock and at the right price.
Remember I told invest and not trading 😀
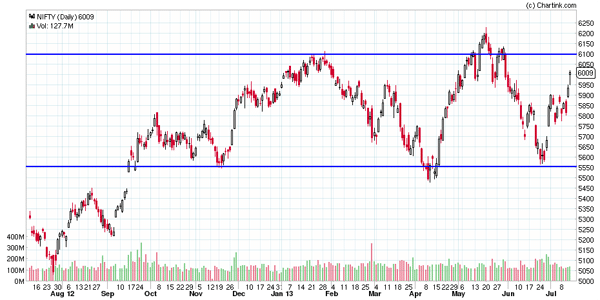
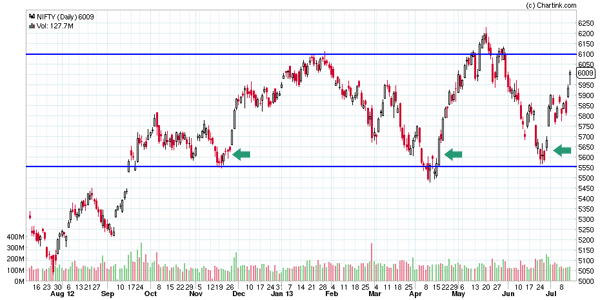
Let us begin with looking at 1-year daily chart of Nifty.
In the above picture, I have drawn 2 horizontal blue lines around 6100 and 5550 levels. The importance of each of those levels is significantly high and this can help us to find the right stock to investing and at the right time and at the right price.
Significance of Nifty Around 6100
6100 Nifty Level is very important for Indian market. In December 2007 January 2008 time, Nifty touched 6100 and everything with respect to Indian Equity market and India as a whole was looking awesome. Investors never could have made a wild guess of a crash in Indian market but then the crash came in and Nifty touched almost 3000ish levels.
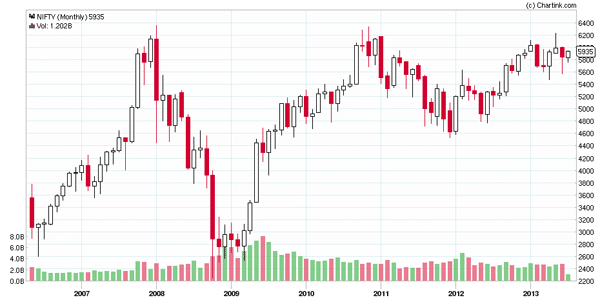
8 years chart of Nifty
In November 2010 almost after 3 years Nifty again tested 6100 and then Nifty yet again reversed to 4500ish levels in next 12 months.
After touching 4500 Nifty took 1.5 years to reach 6100 yet again and as expected 6100 again proved to be vital resistance point that Nifty could not cross.
So the significance of 6100 is quite a big even when investing in the market because market and especially Nifty looses all its steam around 6100 and has reversed significantly from that level multiple times.
How Longer Term View May Not Help In Wrong Stocks
Now we know 6100 is when Nifty has shown signs of weakness. So now we know for sure when it may not be right time to be investing in the market even for a longer term around those levels. I get so many emails and phone calls where people say they are long term investor and have remained invested in many stocks for almost 5 years+ and still the valuation is almost half of what they have invested. Forget about the profit. They want me to suggest how they can just recover the money they invested. Reliance Industry or Ranbaxy are few such stock examples that I get from user emails and so let us see charts of both of them for last 8 years.
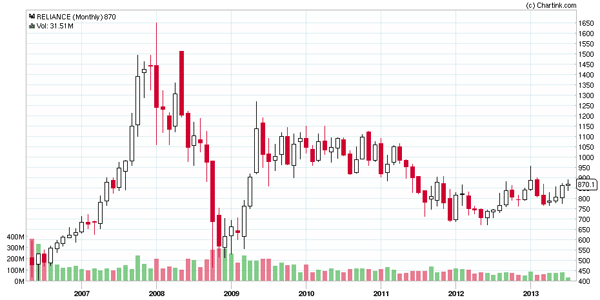
Reliance Monthly Chart for 8 Years
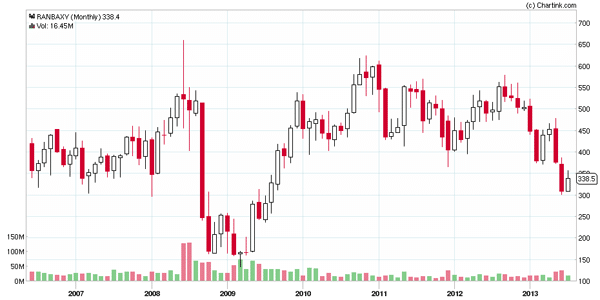
Ranbaxy Monthly Chart for 8 Years
You can clearly see in the above stocks, the return on investment from 2007, 2008ish time till date is almost nothing and such stocks are endless.
So even if someone remain invested in market for 5 years, still may be struggling to recover invested amount where as in other non-risky investments, you amount could have easily doubled your investments.
So you have to be choosing the right stock and investing at the right time and so let me help you do exactly that.
Significance of Nifty Around 5550 – The Right Time
Now we know for sure the not so right time to be investing in market i.e. Nifty around 6100 and so now we have to be finding the right time to be investing and this can be done if we re-analyze the first chart of Nifty. In the last year or so we find that Nifty bounced back almost 4 times from levels of 5500 clearly indicating good support zone for Nifty. So invest in stocks in the leg up after the support is tested and not broken by Indices.
Investors do not have the time to track daily movement of Nifty. So we have to have support levels for Nifty that we keep a watch on and in our case it is 5550. Once Nifty starts falling and there is buzz in the market about what would be the next support, this is when investors become active and watch out for the support level. Once Nifty hits that magical level we can keep close look on how it performs. Once we see that Nifty has not broken the support significantly for a week or two, we can think about investing in the stocks of our choice.
So now we know the right time for market for our longer-term investments so now let us find the right stock as well.
Finding The Right Stock For Investment
We know it is the right time to be investing in the market but then we have to find the right stock as well. So here is what I follow when it comes to finding the right stock to invest.
I prefer investing in stocks that are close to 52 weeks high (opposite to those who prefer buying stocks that are close to 52 week low). These stock may give break out very soon because Nifty and other indices had lot of correction but these stocks were least effected by the downward movement of indices and Nifty and are trading very close to their 52 week high.
We know this is right time to invest and we have lists of stocks that are our potentially right stocks and so what next?
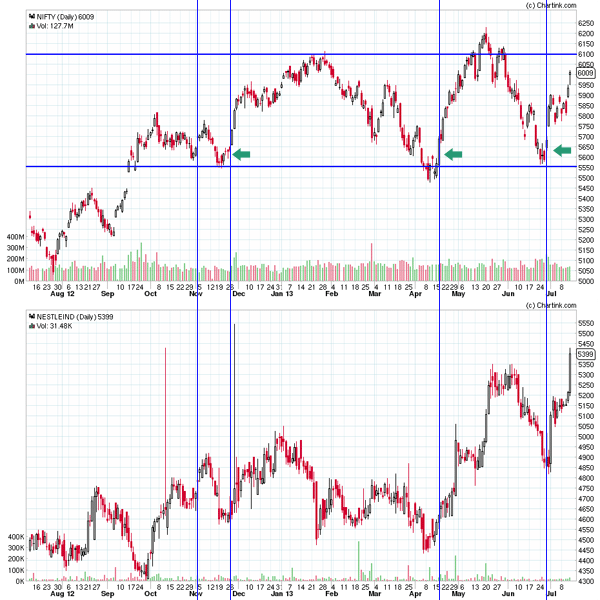
Let me explain this with an example of Nestle India which was hitting 52 week high in that time frame (and I have made quite a few investment into it) as well when Nifty was in correction mode.
Clearly the vertical blue lines tells that stock has been doing significantly well with respect to Nifty and so it could be that once Nifty starts performing, this stock may do wonders and we see same thing happening.
A point to note here is that we know the right time for the market and the index but this may not be the right time for all the stocks we may have from our list. It means you may need to wait for few days to see if the stock’s correction mode is over and if it has started moving into the leg up maintaining the support level. This has dual advantage to re-verify if the leg up in the market is intact or it was just a blip that you misread.
Final Thoughts
Are you still investing because someone else has invested? Its time to educate yourself and I have explained the entire process I follow for investments and it has worked for me really really well and I hope this helps long term investor invest with confidence in market. If you have any questions please speak your mind out in comments below and I will be more than happy to answer them. If you want to be sharing your feedback, you can do the same in comments and I will love to read them as well as apply them to make this blog better.
Charts by ChartInk.com



Very informative …..thank you shabbirji…
The pleasure is all mine Hiren.
Thank you Shabbir! Really appreciate your efforts to share your knowledge.
For long term,do you suggest MFs over stocks(Your view on it).Appreciate you could do a similar technical stuff for MF as well, especially parameters to look into..like expense ratio,performance etc.
No I don’t suggest mutual funds for those who can handle the stock investment but for those who are not able to do that, it is completely ok to get moving with mutual funds.
Yes I have done the same here though the way I have created the charts is outdated and you can get them from moneycontrol directly.
Hi Shabbir,
Do you support idea of buying a stock when it falls to a level where it shows strong support ?
To me SBI & Titan Industries seem to have strong support at their current levels. Do you think its good idea to take position in these stock now?
Yes I do support but you should not be buying in the leg down but in the leg up once the support is tested and formed a bottom.
About SBI and Titan are not a buy for me currently and to answer the why, I will suggest you to join me on hangout tomorrow 8th Feb at 11AM( http://shabbir.in/hangout ). Its free QnA sessions.
Thanks for very knowledgeable article.
I have compared Tech M and CNXIT with NIFTY on the same lines. TechM appears to be doing much better than Nifty and even much better than CNXIT. Is it therefore good candidate for investment when Nifty makes a low. ?? But the problem that it appears to be oversold technically at the levels of Nifty lows. May like to clarify this point ,pl.( I hope I was able to explain the Q) . Thanks and Regards.
The site is very good after the changes made. Keep up the good work. God Bless
Vinod, I don’t trade / invest with the theory of oversold and and overbought zone. I work on few patterns and clearly as of now this is not a buy signal. Long term trend is up but if 1740 is not broken, there should be a consolidation and then may be we can have a pattern for buy.
Shabbir, thanks for the wonderful article! Really a good learning experience for a novice like me.
I am planning to invest in stocks for a long-term (10/12 yrs). As I don’t have any expertise I am planning to invest through through SIP mode (in a monthly basis).
Does the SIP mode really help in overcoming the market volatility and give profits. Or is it only thorough investing by market analysis we can earn profit.
Thanks, Tridip K Sarma
Tridip, welcome to the world of stock market and investing and I would like to congratulate you on couple of things. The first is you are planning your investment and is eager to learn how to invest and second you have a bigger view of longer term investing.
Now coming back to your investment questions, yes SIP helps circumvent the volatality to a large extent but then SIP is not enough to be making good profits from market but analyzing your investments as well as making a switches from one investment vehicle to other is also needed to make decent profit from markets.
I hope my answer is helpful to you.
Dear Shabbir: What you are telling is partly true. But, in the present global scenario, my opinion is that we should adhere to the principle “Buy Low and Sell High” and come out from the market without any loss. Due to very bad situation in US and in Europe, a double recession and Stock Market crash is going to come soon. We have to see in which month it is going to come. We should look for that opportunity.We are seeing the distorted pictures about US and Europe, now.
Regards.
Chennai 600091.
The biggest problem is understanding the low and most of the times it is much more than what we have anticipated and then once we see that we always get into the mindset that will come out of the situation at no profit no loss kind of levels.
GD MNG
THKS A LOT
YOU HAD GIVEN A VERY GOOD LINE FOR ON PURCHASING A STOCK
CAN YOU GIVE GUIDELINE ON SIMILAR LINES , ON WHICH STOCKS SHOULD BE SOLD AT 6100
AS SAID , SELLING AT RIGHT TIME IS EQUALLY IMPORTANT
REGARDS
That should be based on your target which you set at the time of buying.
I agree technical analysis work better on long term charts rather than finding short term supports on short term charts
I thought the other way round is better choice but can be applied to long terms Harsh
Good work, keep it up.
Hi Shabbir,
This should be a tricky question for you..last year i have realized that i would be losing money if i invest in midcap stocks(generally when i pick a stock in last 3 years it has fallen atleast 40% from my buy price) so i decided to buy the bluechips but the samething happend to them as well for the likes of Bharthi Airtel,HDIL,Yes bank and now Ranbaxy(all this bought above 200 DMA).
Please advice how i can improve to pick the right stocks
Uday,
The point is not to buy the right stock only but it is also important to be buying at the right time and at the right price and that is when you will be able to make money from markets.
I have been teaching the same to all my readers in my ebook – http://shabbir.in/go/book
And most of the people who have my ebook have benefited immensely from it. You can read the testimonials as well.
Shabir,
Trying to understand your logic of picking 52-wk high stock while nifty reaches its support level.. (FROM A INVESTMENT PERSPECTIVE)
Nifty is at 5565 and TCS close to 52-wk high at 1850. If there is a rally do you expect TCS to go further, if yes, the buyer would be at risk of correction soon?
Wouldnt be less risker to pick a stock with good fundamentals which is closer to 52wk Low which would anyway rally?
Am I wrong?
Sathish can you answer one question which is – Why do you think that a stock that has not done well for last 52 weeks will do well in the 53rd week onward?
On the contrary a stock done well for 52 weeks has more chance of doing well for few more weeks going forward provided it forms the patterns that you are comfortable.
Thanks Shabbir, makes sense.. however, a 52-wk high stock will have some hype built into it and correction is always a possibility. hence, the pattern is important I believe..
Correction is always a possibility and that cannot be ruled out on 52 week low stock where the correction is on the long side and then the fall is more than what it was.
Dear sir,
can this book available in booklet form because i dont want online.if yes pl.mail me and whats prise details also.
thank you.
No only in eBook format which you can print if you want.
Good one, and would help those looking for ways to enter market and exit….! Definitely this is not the time enter now.
That is what I think and is doing.
But 6200 and 6300 have been equally valid resistance levels in the past. So what’s special about 6100?
6100 has been more times a resistance than 6200 or 6300.
Is 6100 for nifty as stop and reverse (rather than 6200 or 6300 – levels previously touched) just a matter of personal preference or are there more reasons?
No there is a reason which is 6100 has been a resistance and we are investing and so we will not sell in the leg up but in the leg down when 6100 is not maintained.
In the given example when would you say Nifty has broken above it’s resistance? Once it’s above 6100, 6,200 or 6.300?
It does not matter because we are trying to find the entry point near support and may be sell out near the resistance and not wait for the breakout.
Still to answer your question, I would say previous high of 6100 is when i would consider a breakout with a strict stop loss.
Thanks. Well explained about entry level.
Though long time investment, I feel it is equally important booking profit at significant resistance levels.
Thanks
Yes always Padmakumar.
Thank you. I have learnt something new. I have suffered the same in L&T
The pleasure is all mine Viraf
But each time a resistance or support line is retested, chances of it being breached get higher. Like waves continually lashing out at the shore taking with them a little sand each time, until finally the shore-line breaks down. Now to determine whether the resistance / support is broken or whether it still holds is not as simple as it seems to look. In your Nifty chart example itself we fine that in January 2008 and November 2010 Nifty found resistance at 6300, not 6100. In January 2013, the resistance was at 6100, but in May 2013, resistance was at 6200. True, Technical Analysis is not rocket science but how one decides a particular move is a trend continuation pattern or a trend reversal / retracement pattern is the million dollar question. I believe lots of fine-tuning is required.
I agree that lot of fine tuning is needed but then for longer term investing, you are not trying to time the market to prevision but only trying to see the trend and if the support is not taken out and Nifty makes its way above the support, it indicates that the time to investment is ON.