Technical Analysis Forum to discuss stocks, technical’s, investments as well as ways to make forum a better place for everybody to learn and share the art of trading and investing in market.
It’s been almost a month since I posted about Intraday Shorting Strategy and I have been very busy with the launch of Technical Analysis Forum – A closed forum for my eBook customers where we discuss stocks, technical’s, investments as well as how we can make forum a better place for everybody to learn and share the art of trading and investing in market.
Only members can read the forum but I would like to share few things that we have been discussing in forum.
Discussing Opportunities
Members when they see opportunities in any particular stock and can ask my views on it as well as other members views on it.
Spotting Opportunities
When I see formation of any pattern, I share the same with other members.
Lighter Stock Discussions
Members shared their list of best stocks and as expected Nestle India was among the members choice of stock by members possibly because I share a lot here about Nestle.
Final Thoughts and A Free Invite
To grab your free invite to the forum, share your view and thoughts in comments and I will select one reader in the next 24-48 hours from the comments who get his/her free forum access.
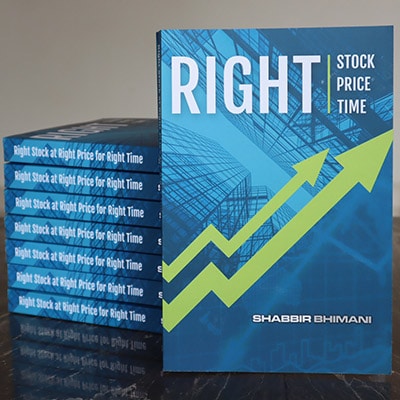
Just in case you want to join forum instantly, grab a copy of my eBook now.


Hi Shabbir,
I have just started trading and am confused b by the contradictory readings from different charts/timelines (i.e. daily, weekly, monthly). As of now I only use basic trendlines ,OBV and volume indicators. I am looking at an investment horizon of 1 month to 6 months. Could you suggest how I should look at different timelines. Also what other indicators I should look at.
Thanks
Trushant, that is what I have explained in my eBook here as well as in the following free technical analysis tutorials
Dear Shabbir,
Thanks for the knowledge sharing that you are doing through your website.
I am trying very hard to make an Excel for trading (To be used as a Screener). This will allow me to screen and decide on my own indicators.
Now the indicators that i choose were
1. EMA – 5, 8, 10, 20 – Trading on EMA crossovers
2. SMA – 50, 200 – Trading on Price moving above and below these levels along with Point 1.
3. MACD
4. Camarilla Pivots – To decide on SL and Targets
5. Fibonacci Retracements – To decide on SL and Targets.
6. Bollinger Bands (Not Extensively used) – for identifying Squeeze.
7. Final but the important part is considering only stocks with VOL above 5 Lac
Now my question is will i be able to identify and trade atleast with 70:30 Profit : Loss ratio with these indicators or do you suggest to add/remove any of these to make my excel meaningful and useful.
I can share you my excel once verything is ready.
Thanks in Advance,
Sunil.
Sunil, glad to see that you found the content on my blog useful.
Now coming back to your list of indicators, I think you have just too many of them. Apart from that you are trying excel to create stock screener but I prefer less humanly efforts to get things.
Now coming back to your success ration members of my forum have more than 80% to 90% success ratio and they use forums to ask my views on the stock and then trade. I not only share my views on the stock but also share why I think along that line and that has helped members expertise my way of trading and now they are even helping others when I am not online. 90% is not what I say everyone would be able to get but then it is not something that is very difficult as well.
Now when it comes to screening we use just one indicator and that says us all the stocks we can consider and then apply the support and resistance pattern to be into the stock at the right time and at the right price.
Thanks
Shabbir
You are most welcome sir.
Profitable trading to all !
Great website here on some key technical analysis points, great site for all to follow.
Thanks for the wonderful feedback Alex.
Winner of the contest is Rajendra. Congrats 😀
Hi Shabbir,
Infact, this idea has been in my mind for quite some time. I had thought of seeking your help to create some blog with similar idea. But at all instances, i have found your replies to many that you never specify individual stocks or price targets and only help people identify technical levels etc..I would say this would be a great initiative and would help not only your existing followers, but would bring in a very larger community of like minded people to the picture. Your technical expertise would ofcourse make this a definite hit. But I would suggest you to possibly include other parameters like
1) Valuations
2) Credibility of management
3) Short term, Medium term & Long term trends(Stock specific & Sector)
4) Prompt monitoring to ensure spam free, ad free, promotion free, vested interest free environment.
5) Uptodate news ( Confirmed news and views should have some status sort of indication)
6) Fundamental & Technical Views
7) Promoter plays
8) Dividend payouts
Points 4 & 5 point towards more or less the same thing i.e., MODERATION of the site.
(My priorities for the points would be in the order 1 – 8)
Wish you all the very best in your initiative.
Thanks
Naveen
Naveen, thanks for your deep thoughts on this but what I prefer writing is what I don’t track those many parameters when I am active in market and so I don’t think it would be fair writing about them but yes if I do some fundamental analysis of companies, I do write about it.
Dear Shabbir,
The stock you are referring to that is going straight up for three years is –
TTK Prestige (BSE: 517506 ). Please advise.
Best regards,
Veeraf.
No I did not not refer to TTK Prestige in that thread Veeraf
Simplicity,brevity, realistic& To the point is your” MANTRA “.Hence it will help a lot to the genuine investor.
Thanks Dr. Balabhadra Ram for those kind words.
sir. .please. don’t give 24 hours time limit….because now a days everywhere u will find corruption ..A raja..getting hero’s welcome…market is down…..our morals are down…v r short of penny….only people like u can do wonders and show us new way….
Saeed, what time limit do you prefer.
Hi Shabbir,
Thanks for the updated, I will certainly take a look at your book on TA and hope to benefit from the same especially with spotting trends and reading charts with indicators.
Finally does your book suggest any particular software / tools that may be required to guide us to a profitable trade.
Thanks and regards
Gregory
Gregory, any software should do the job for you because my methods are more based on price action strategy and not mathematical.
Hi Shabbir,
I wish to place an order for the E book but unable to find the link with the discount mentioned in yesterdays mail.
Therefore could you please check and let me know how to go about odering the same.
Thanks and regards
Gregory
Hi Gregory, I have sent you an email regarding the same.
whatever comes under the title Technical analysis, mechnism to work in the stock market etc from Shabbir or from his E book are explained in very very Lucid language without bombardment of any jargons.
Thanks Ravindra for those nice words.
The book value ( total value of the company’s assets that shareholders would receive if a company were liquidated) of Infosys is about 425 per share. But it is being traded at 2400 levels per share. that means that a buyer is paying more than 5.5 times of the share value.. And the buyer expects to sell it at a higher price, let’s say he expects some one else to buy the share share after couple of months at 6.0 times of the book value.. And why would he expect that? What is the rationale? Is there any real math behind this expectation? When One buys a share he becomes one of the share holders, in raw terms he becomes the owner of the company to the extent of his share book value. He will have benefit from the company’s profits or losses from then on until he owns ownership.. Now, the company’s net profit per share is about Rs.100 a year. So, while paying 2400 per share am I expecting 100 in return per year? that is about 4.5% way below than the interest I would get on a saving account. So, people are clearly manipulating the prices by sentiments and unrealistic exceptions. that is the reason why you see the great volatility in the market prices that react to every good and bad news in the economy, making one to loose at the same time another to gain. This will continue as as long as we have these share markets and people see value in this fictitious economic value addition. Let’s play the stock market game (calculated gamble) until people loose faith in paper currency. god knows when that happens!! Bottom line is when you trade the shares you are paying with sentiments of the people to a large extent.
Read more: http://www.investopedia.com/terms/b/bookvalue.asp#ixzz1v20zIT00
Ganga, I don’t agree with your analysis at all. Company doing good needs a premium because share price is not a factor of only current book value but what book value and growth company can attain in future.
2400 Rs with EPS of 100 Rs but you are not going to make 100 Rs on 2400 and so return of 4.5% is not what you would get anyways.
Hi Shabbir,
It’s wonderful to note that people like you are educating the masses on the technical jargons of stock market investing, but in this high tech world the game has been changed by the big guys playing more on the sentments of the people to make a killing by fear n greed method, were upon all fundamentals and technical analysis fails. Therefore I would like to know if there are any advance indicators in TA for the common man to take the safety path.
Gregory, I do agree that market is being played by big players and so you have to understand which is the right direction to play with the indicators and play with them and not against them.
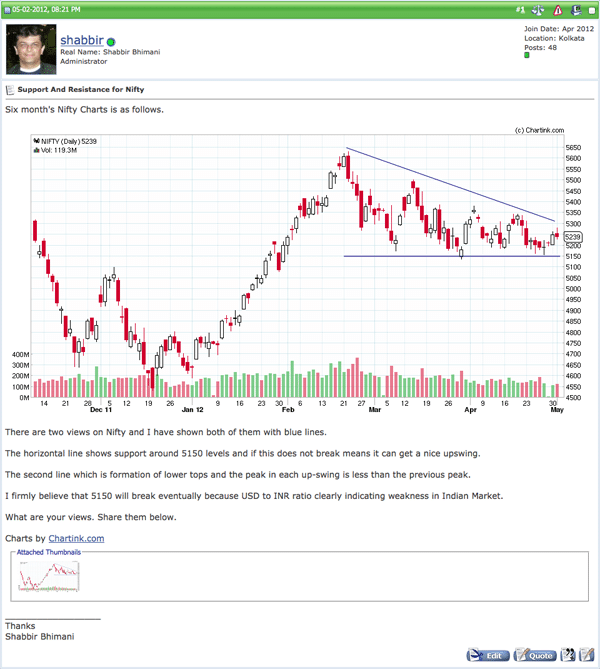
Let me share with you an example from the above screenshot. 2nd of May I spotted that Nifty is not able to do much and would eventually break the support and you can see that I have 2 blue to suggest the same. I shared what I think of the market and more clearly why and so waited for the support to crack and traded with the trend to make profit from it.
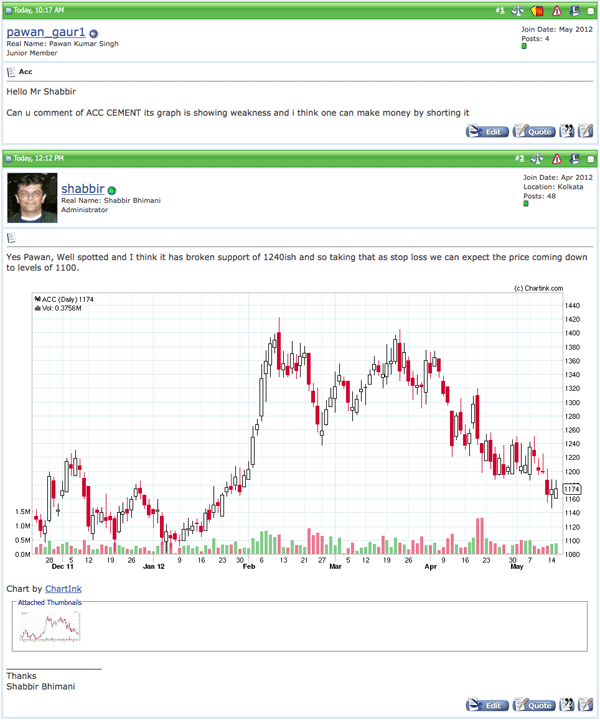
So I would say that market is played by big players but then they also are aware of what others would be playing and so they also don’t tend to trade against the trend and so if you can spot the trend, you are definitely going to profit from it. See how one of my readers identified ACC and I expect it to follow the pattern yet again.
Hi Shabbir,
I always find your articles well written & to the point & as such I have no doubt that your technical analysis book will also be informative. However I would like to ask you if there is anything new that can be added to information that is already available freely on net.
I guess this query may exist in the minds of many & so addressing this I am sure will help increase sales. By the way starting a forum is a brilliant idea & most newbies (including self) will find it irresistibly attractive (including self). It definitely signals an intent on your part to be committed for long term to those purchasing your book .
I have read technical analysis mostly from investopedia & such other sites. As yet I have not traded for a living. I have been day trading for past several years only as a “time pass” & when time permits, idea being that 5 odd years down the line when I stop working I should be able to trade for a living. Will your book help me do this?
Anyhow once I am home in next few days (presently working on ship) I do intend to buy your book & looking forward to interacting with you.
Best wishes & regards/ Raj
Hi Rajendra,
Good question and there are lot of free technical analysis tutorials I have on this blog itself and yet I say that there is lot more that cannot be added in blog posts and so the eBook. I would say those 10 articles is very small percentage of information that is clubbed in the ebook.
Regarding long term view yes you can safely assume that from my sites and product and this blog is now more than 4 years old. Posts from 2007.
Your and my experience with trading is more or less same and I hardly have time from my site to trade and still trading is something that I cannot live without. It makes me into the world or else I would not care even whats going on in my vicinity.
Great to see that you are trying to learn but reading from a site like investopedia or even forums like traderji means you are not following any one pattern of any one person and so it becomes difficult to relate many things and I found lot of issues doing it that way.
Thanks
Shabbir
This is a very nice initiative and I can say for sure that its going to a major success. Everyone is gonna benefit from this. I hope to contribute to this list to my extend.
Thanks
Shijeesh, Thanks for those kind words and yes it was one of the top few things that my customers always wanted. A platform to interact.