How I use these 7 websites Screener, Investello, ValueResearchOnline, MoneyControl, BSEIndia, ChartInk, TradingView to quickly reject not so good investment opportunities
My stock screening process is rigid. Very few stocks can get through my Investment Checklist, Fundamental Analysis and Business Checklist. The process is long but one has to make it interesting as well.
So when I am analyzing a stock based on my stock selection process, I make sure I can quickly reject not so good companies in few moments using online tools. I take all kind of help using the online tools to conclude about a stock as fast as possible.
So here are the 7 sites I use in the given order to help me analyze a stock.
1st Screener.in
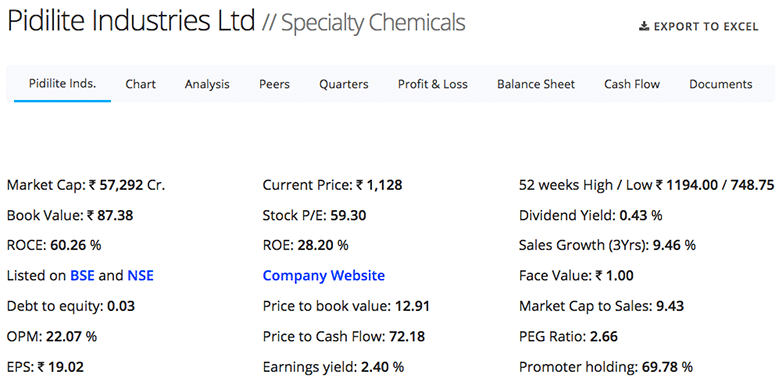
The first line of rejection of any stock is always based on debt and few other ratios like Debt to Equity Ratio or always profitable operations, better ROCE, good profit margin or OPM.
Screener helps me customize all the ratios I want to see at the top of the page for any stock in my account.
So any stock with high debt, less promoter holding, or not so good OPM etc is rejected just by one view of it on my screener account.
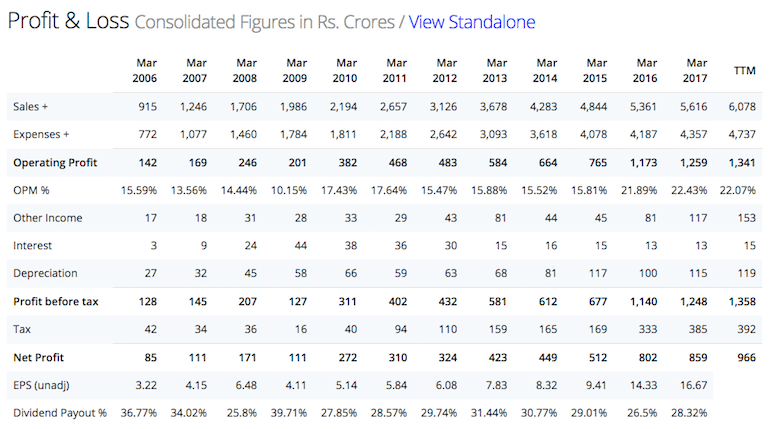
The next step is to see the profit & loss screen in Screener where I can see how the company has been making profits over the past decade.
It may so happen some of the ratios are in line with what I like to have but some aren’t. So I consider the stock for further analysis to see if I can make an exception.
My investment in Jubilant Life in August 2016 despite high debt was because it never made a loss in the past decade and one year when it made one, it was for accounting reasons of change in inventory.
2nd Investello.com
When most of the first line of basic parameters I have in Screener are in line with what I prefer. The next step to consider is growth for past decade.
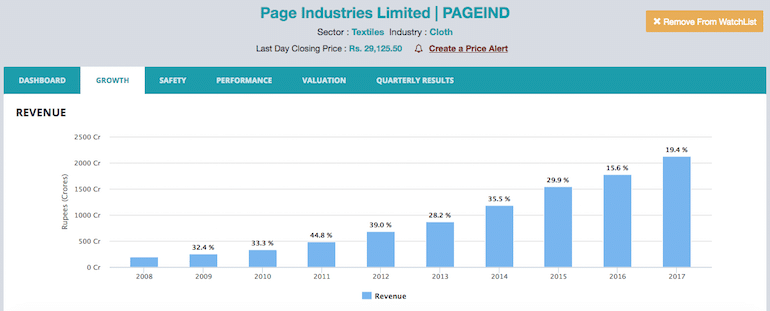
Investello shows the revenue growth graph of a company in the past decade in a very easy to use format.
Revenue growth is one of the prime factors I consider for investment. The visual representation of the revenue growth for a company for the past decade helps get the complete picture of growth.
Note Investello doesn’t track all the companies but it does track most of them. If you don’t find some company at Investello, it is because they haven’t covered it still.
3rd ValueResearchOnline.com
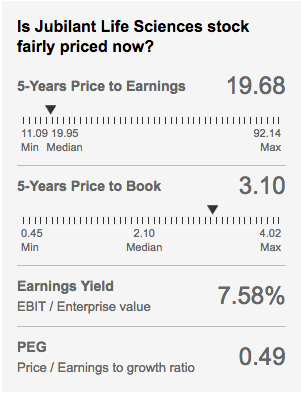
Once the company has good growth, the next thing I see is the historical EPS and PE of the company.
Is the stock trading at much higher PE to its past 5-year average? The data is available in the sidebar at ValueResearchOnline.
Often investors like to compare PE Ratio to its peer but when you invest in unique or niche business, it is tough to compare with peers. So I prefer to use the historical average of the company’s PE to see if the stock is trading at a discount to its historically traded PE ratio or not.
4th MoneyControl.com
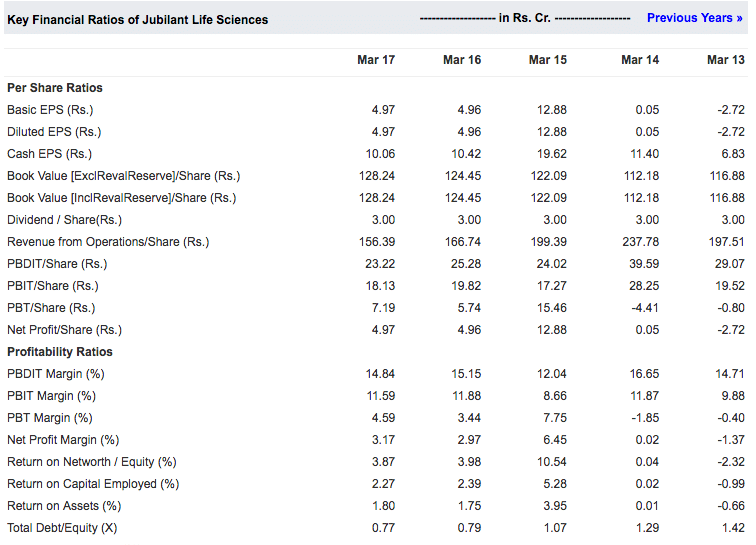
In the first step when I make an exception for any ratio, I like to see how the ratio has played out over the past few years especially debt to equity ratio.
This is crucial information for me as I am doing an exception to my process. So I like to see things moving in the direction I want it to be over the past 5 year period at least.
So if you look at the Key Financial Ratios for a few years, you can get the idea of it has been panning out. If I see a reduction in debt by the management, it is considered as a good sign for me provided all the other aspect of the analysis are in line with what I had preferred earlier.
5th BSEIndia.com
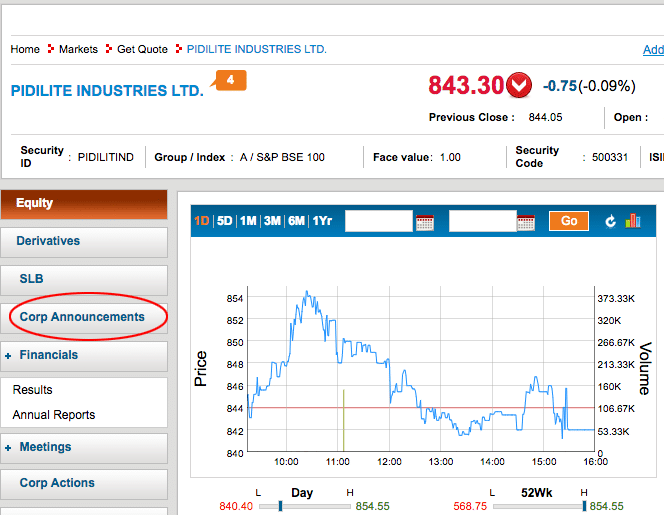
The next website in the list is BSEIndia. I like it’s simpler navigational structure of information than NSEIndia.
So my preferred choice of website for corporate announcements, shareholding patterns, annual reports is BSEIndia.com and not NSEIndia.com.
On top of that, some of my investment is in stock that is only listed in BSE and not NSE. Force Motors is one such example but there are others as well.
6th ChartInk.com
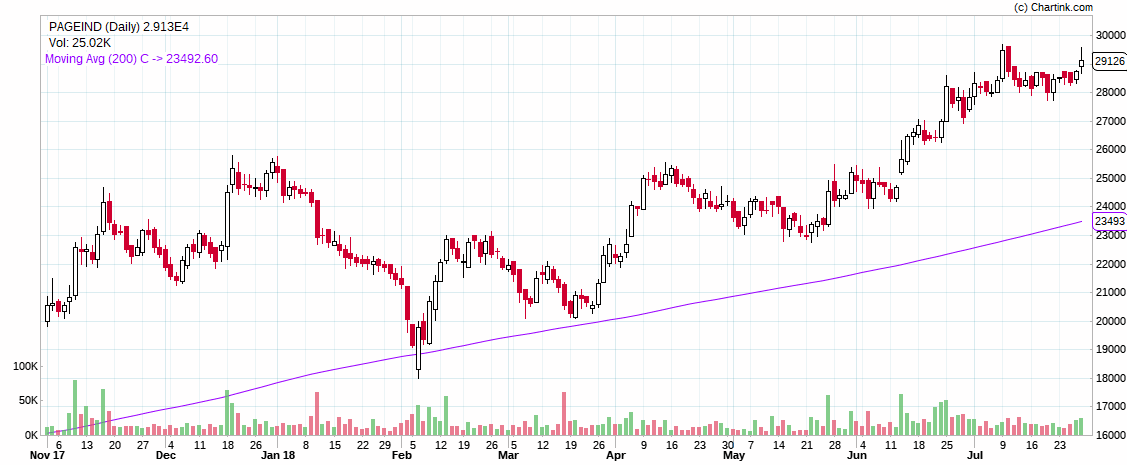
Once I am fine with companies fundamentals, I tend to add it to the list of stocks for trading and investment both. So now I look at the basic technicals to start with.
- What are the support and resistance levels for the stock on daily and weekly charts?
- Is the stop loss at a comfortable level for better ROI?
So on and so forth.
If stop loss is too deep on daily charts / weekly charts, I wait for a formation of new support levels for trading positions.
7th TradingView.com
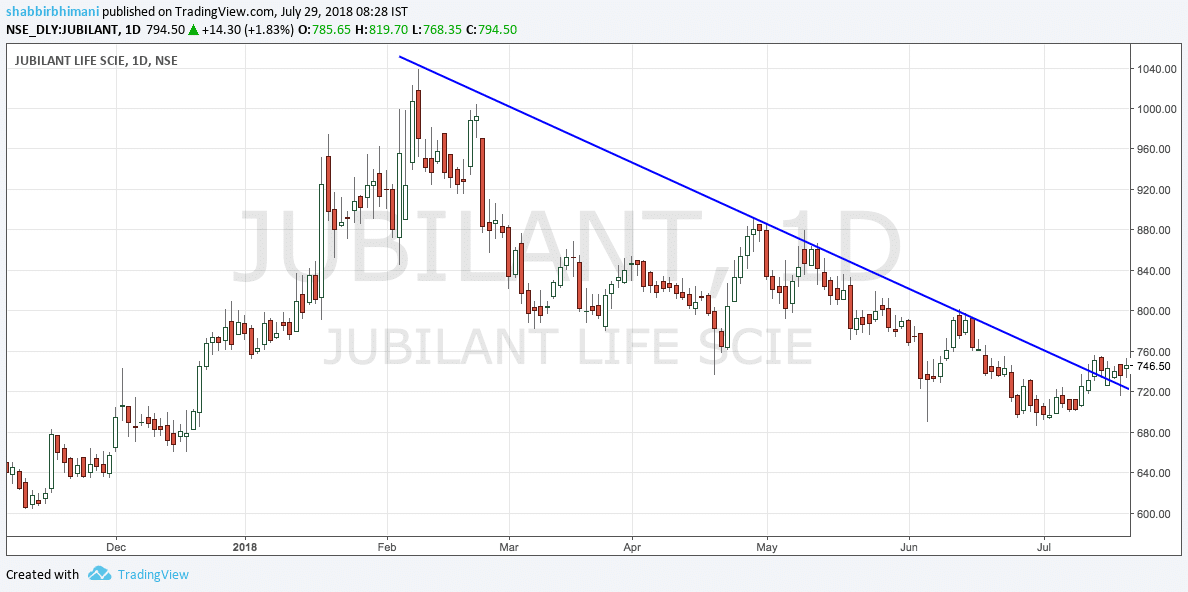
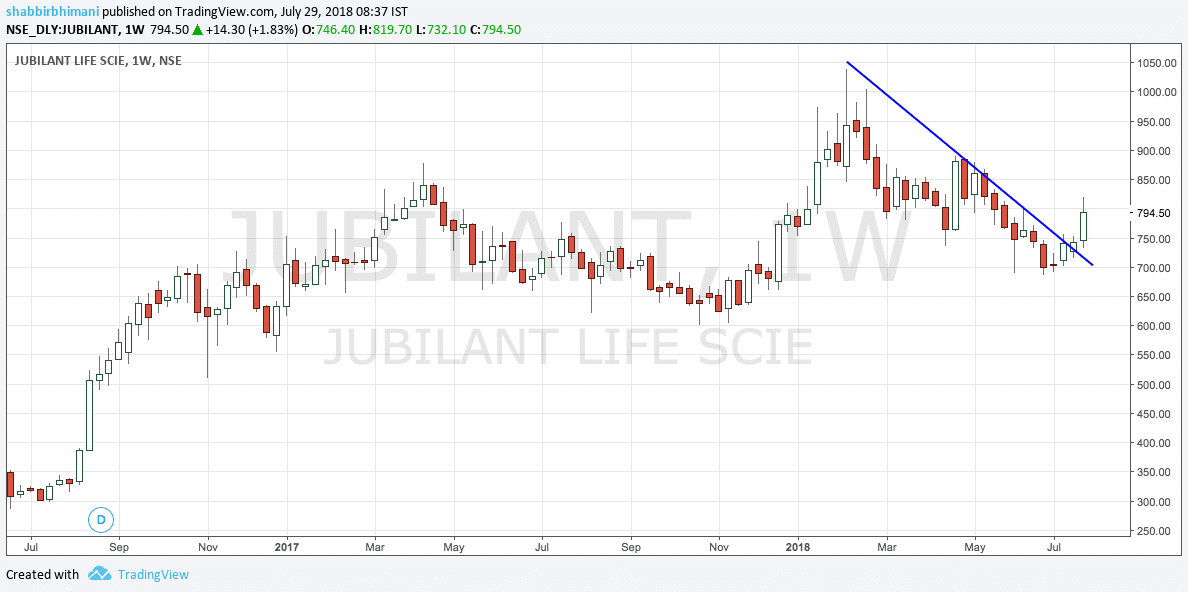
The best part of using TradingView is, one can draw a study or a trendline for a particular stock and one can then view the same trendline on various charts.
I drew the trend line on the daily chart of Jubilant Lifescience, it will remain whenever I open the chart of Jubilant Lifescience but more importantly, the same trendline will adapt to the weekly chart as well.
So any study for a stock remains for that stock on any chart. It helps me to take positions at the right price.
TradingView isn’t only used for trading but if I consolidation pattern being formed, I invest over time and keep accumulating close to support levels.
Final Thoughts
This is how I analyze the stocks using online tools to invest in the right stock and then use technicals to buy at the right price. Neither this is the only way nor it is a perfect way of doing it.
This is how it works for me or I can say this is how I made it work for me.
Adapt the same or make changes to suit you. Make sure the approach is such that your portfolio remains protected from stocks like Vakrangee, PC Jewellers or Manpasand Beverages. Even if your current process includes them for consideration, make changes to keep such stock out of the portfolio.
Whatever be the process, let it evolve over time.




very detailed information , thanks..
Thanks.
Is the stop loss at a comfortable level for better ROI??
So do u put ur stoploss based on support levels in different time frame or just few % below buy prices.
The amount I am fine loosing if I had to execute the stop loss.
Eid Mubarak Sir.
There is so much more to learn. Comparing historical PE over PE to peers is something that makes so much more sense.
Glad it help you learn something new.
https://www.morningstar.in/tools/default.aspx?type=equities
this website is useful to know MOAT. it might help you
Yes nice site.
Regarding revenue growth, what growth should be minimum to pass your check list ?
i mean 5 or 10 year average growth in %.
I like it to be 10% but there is no general rule to it.
Thanks sir for all these information. Now it will be easier for us to take right decision at right time.
The pleasure is all mine.