What is Flag Chart Pattern? Understand it with real-world examples and how to apply it to successful swing trade setups
The flag chart pattern is a formation of consolidation in a narrow range after a sharp up move. The best part about flag chart patterns is – it has clear indicators and price action for entry, stop loss levels, and target.
Flag patterns have a slightly deep stop loss but have a very high chance of hitting the target than the stop loss.
What is Flag Chart Pattern?
The flag chart pattern has three parts, the first pole, then the formation of a flag followed by the second pole.
The first pole forms a breakout pattern with higher volumes, followed by a few days of flag formation and a slight dip in volume.
The best part of the flag pattern is, it has a next upright pole, and the most crucial part is, the height of the second pole is almost equal to the size of the first pole.
So one can quickly identify the target range when the second pole formation starts.
Let us understand it with a few examples.
Real-Life Examples of Flag Formation
I prefer to use the Flag pattern on daily charts, but one can also find the formation of flag patterns in hourly and weekly charts.
Force Motors
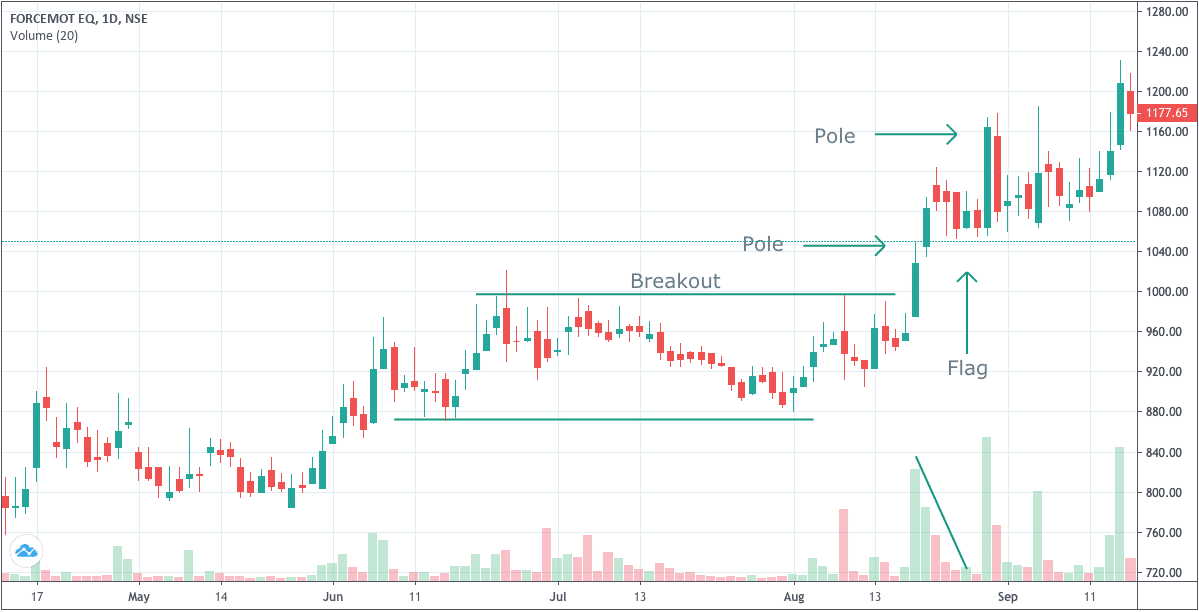
The first example I am going to share is forming a perfect pole flag pole pattern in the daily charts of Force motors.
A breakout above the psychological resistance level of ₹1000 on higher volume and formation of a pole.
Next, we have a decline in volume with a consolidation, which is the formation of the flag pattern.
Then there is a second pole. The height of the second pole is roughly ₹120, which is the same as the height of the first pole.
I have marked a formation of both the poles as well as the flag.
The entry within the flag pattern means the stop loss is low of the fist pole.
The target is from the low of the flag the same amount one adds as the height of the first pole.
So in our case, the first pole height is ₹120, i.e., ₹1080-₹960.
So the second pole starts at ₹1050 and so the target is ₹1050+₹120, which is ₹1170.
Natco Pharma
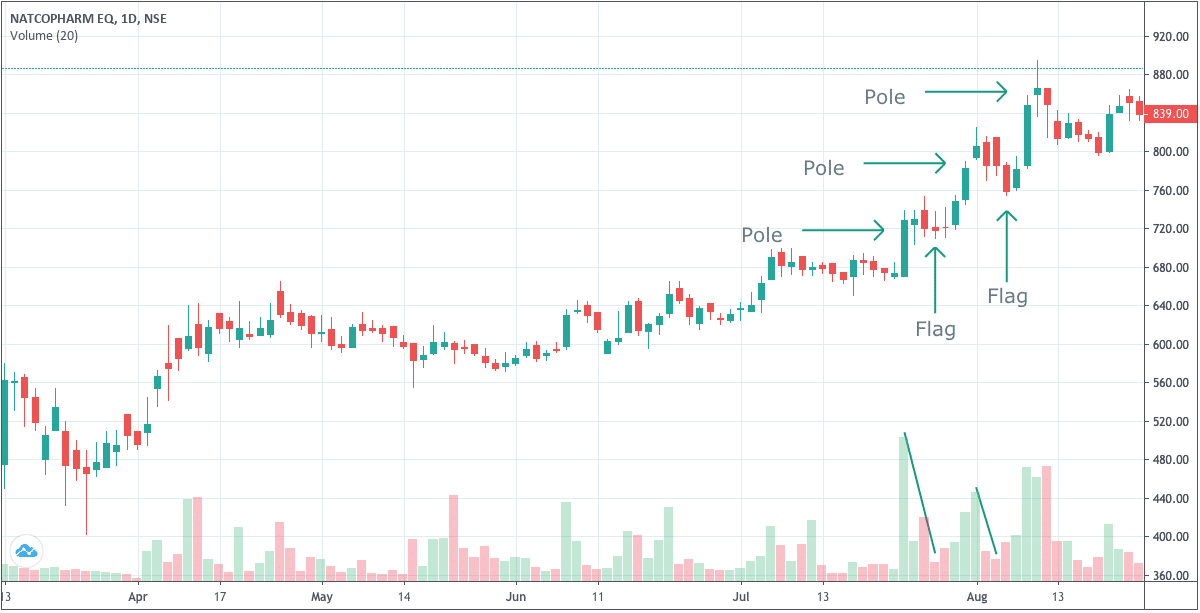
The formation of pole flag and pole can be more than once like we see in the pattern of Natco Pharma
It is much similar to a higher top higher bottom chart pattern.
Vinati Organics
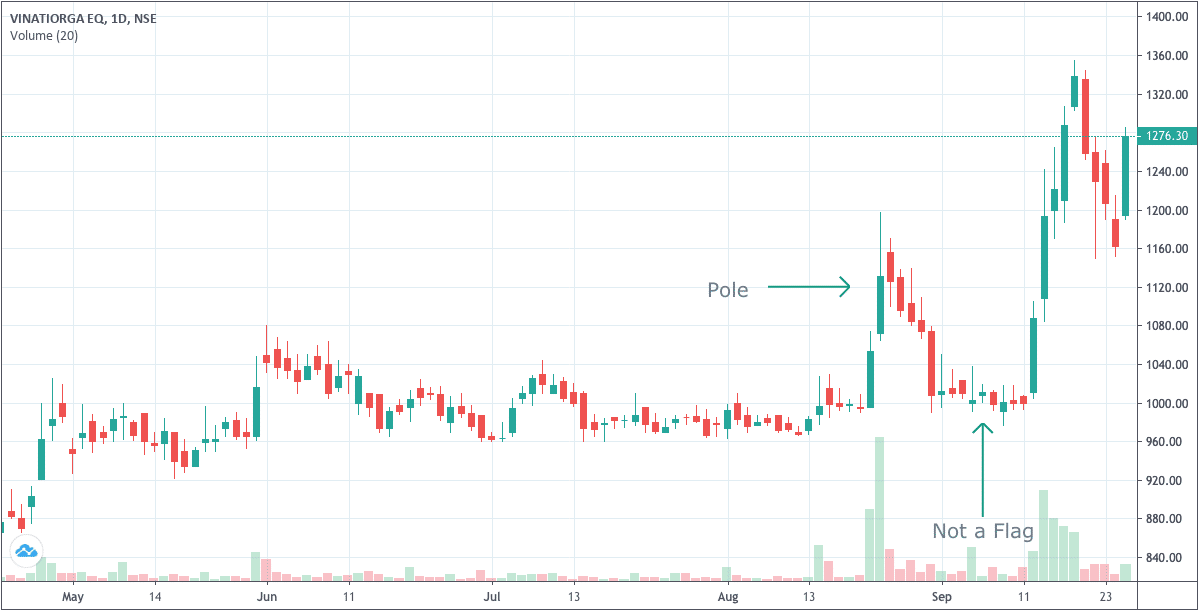
Again, a pole may not always lead to a formation of a flag, as we see in the charts of Vinati Organics.
However, the stop loss of the low of the first pole isn’t tested, which means one can remain in a long position, but then it is not forming a perfect flag pattern.
Again the critical psychological level of ₹1000 proved to be a much stronger resistance level that the flag formation didn’t manage to take out, and the stock came back to a position where it started the appearance of the pole.
However, in the next attempt, the first pole is formed, followed by a flag. Now the time will tell if the formation of the second pole completes or we hit the stop loss.
Why Flag Pattern Works?
The question one may have is why the pole flag and pole patterns form so frequently in the market.
One of the main reasons I see it is – when there is good news, the formation of the first pole starts.
On the back of the good news, some sellers want to move out of the stock. On the other hand, some investors analyze the impact of the report on the longer term and start accumulating. It leads to the formation of the flag.
Then everyone wants to be part of the stock that leads the stock to higher.
Again, the formation of the flag is always for a shorter time frame like on a daily chart; it is for 5 to 15 days. On the daily charts, the flag formation doesn’t take weeks. Once the formation of the flag is more prolonged, one may need to wait for the other set of good news for a second breakout.
Final Thoughts
Flags are continuation patterns and are the best pattern for swing trading. It means the prior trend continues, and the flag is a midpoint of the full swing.
As always, a general note, the stocks discussed in the article aren’t a recommendation but are only for the understanding of the chart patterns with real examples.


Hi Shabbir
Kotak mahindra daily chart seems formed flag pattern recently
My question : first pole and flag is visible but second pole formed 4 candles
Second pole necessary by one candle.. your book example shows only second pole one candle
https://uploads.disquscdn.com/images/fadd5cc1b5a6073840a5c39889d52cfb00f95ec657cdfceefc6921dd517f74c1.jpg
KOTAK BANK CHART
Hello,
If I am averaging out my shares in a stock and then I feel like selling the shares once the share prices rebound, is there any option to selectively sale my shares. For instance if 1st share lot is purchased at Rs 198, while second lot at Rs 200, can I choose to sell my 2nd lot bought at price Rs 200 first and retain my 1st lot instead??
What you are trying to do is all in your head. How does it matter and for what?