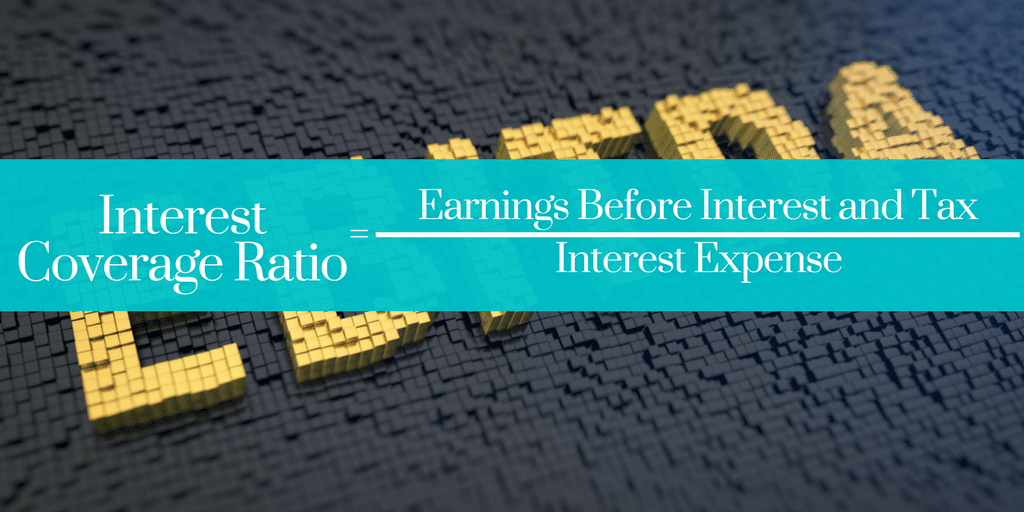
The interest coverage ratio determines how easily the company can pay their debt. The ratio is a factor of companies earnings and the interest being paid.
The interest coverage ratio or ICR determines how easily the company can pay their debt. The ratio is a factor of companies earnings and the interest being paid.
Formula of Interest Coverage Ratio
In mathematical terms, it is the ratio of companies earnings before interest and taxes or EBITDA to the interest expense.
The Interest coverage ratio is available in Screener.in.
What is the ideal value of Interest Coverage Ratio?
Higher the ratio, better for the company. A ratio of less than 2 can mean the company has very high-interest expense compared to its earnings and can have issues paying the debt. Lower than 1.5 can mean the company may not be able to meet the expense of the interest.
The general consensus is to look at the debt to equity ratio and if it is under 1 the stock won’t have issues paying off its debt but it can be often misleading as we will see in the examples. Capex companies that require higher capital to operate have high debt which can mean they have higher debt to equity ratio as well but they never have problems paying the interest because they have it covered with earnings.
Interest coverage ratio is based on most recent earnings and expenses and so it is a factor of company’s short-term ability to pay the interest.
The best example is Larsen & Toubro or L&T (which was part of my open portfolio but I exited quite early in it). As on 14th October 2017, they have a debt to equity ratio of 1.87 but they never have issues with it because they have the interest coverage ratio is 2.65.
Similarly Jubilant Life Science (Which is still part of my open portfolio). They have a debt to equity ratio of 1.18 and are able to reduce the debt aggressively because their interest coverage ratio is 3.21.
If you are considering stocks with higher debt to equity ratio, check their interest coverage ratio.
Examples of Interest Coverage Ratio
Some examples of companies that have the debt to equity ratio of more than 1.
| Stock | Debt to Equity Ratio | Interest Coverage Ratio |
| Larsen & Toubro | 1.87 | 2.65 |
| Jubilant Life | 1.18 | 3.21 |
| Tata Steel | 2.34 | 1.51 |
| Motherson Sumi | 1.25 | 8.18 |
| Reliance Power | 1.54 | 1.45 |
| Godrej Industries | 2.36 | 2.75 |
| Idea Cellular | 2.32 | 0.26 |
| Glenmark Pharma | 1.05 | 6.99 |
| Bharti Airtel | 1.60 | 1.83 |
(All data by Screener.in which is my preferred site for tracking stocks.)
It isn’t difficult to determine the ones that can have issues with their debt.


Thanks, good information.
In the list, Bharti Airtel and Tata Steel is having bad ratios. But these two stocks price is going up. What could be the reason?
The stock prices movement on a day to day basis is a factor of technical analysis and not only the factor of ICR. ICR is more used by investor willing to take a contrarian call on the investment in company with high debt.
Never knew about the interest coverage ratio. Thanks for sharing. Your blog always amazes me with lot of knowledge
Glad it helped you Niraj.