Understand time and price correction with the help of real stock and index examples like Nifty, Reliance, Hero Moto Corp and others
The view for a correction in the stock market is falling prices. However, the correction may not always have a falling price but can be in the form of time as well.
So let us understand price and time correction in the market with examples.
What is Price Correction?
A price correction is a decline of a certain percentage or more in the price from the peak.
The percentage amount varies among investors. Some consider 10% as correction, whereas others are more inclined to believe 33% as a real price correction.
Price correction happens for many reasons. It can be in the form of macroeconomic issues like the current COVID-19 pandemic or sectorial issue to even business or management problems.
The best way to envision price corrections is with the help of charts. So let us look at some of the price corrections.
Price Correction Examples
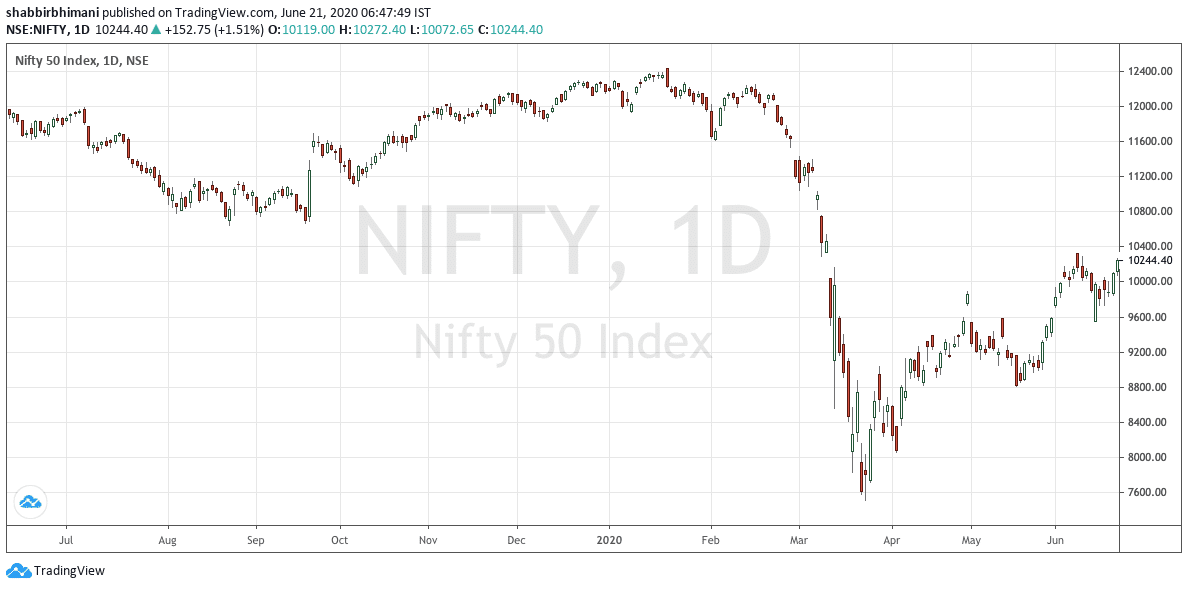
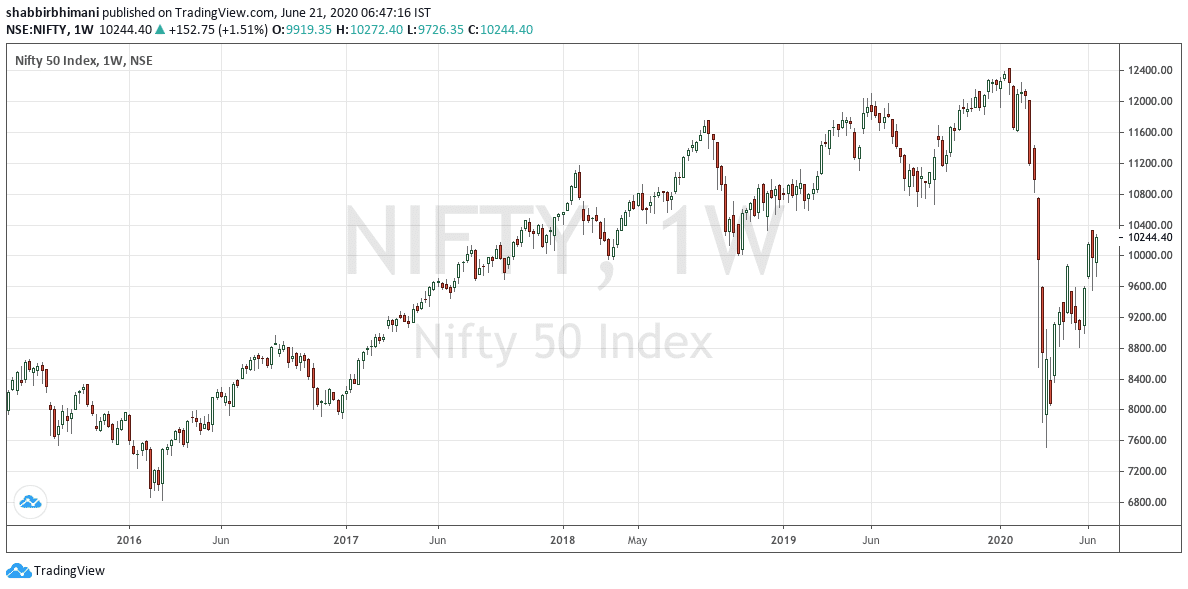
In the current COVID-19 pandemic, we see the Nifty Index moving from 12000+ levels to as low as 7500 odd levels.
The price of Nifty in the correction went all the way to pre 2017 levels.
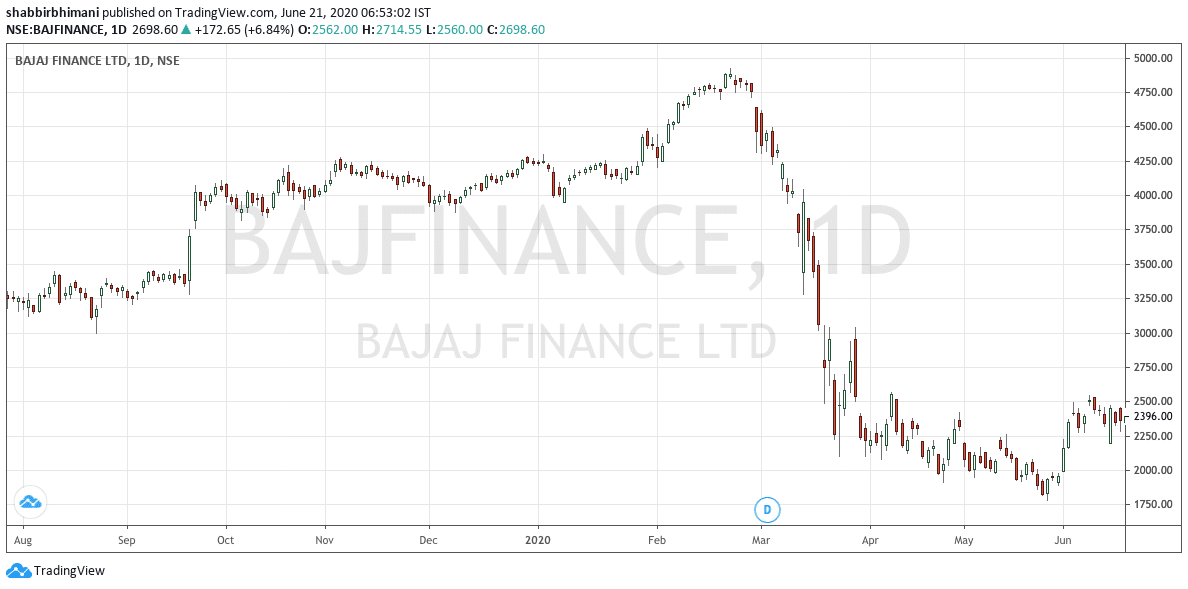
There is a lot of price correction in every Nifty stock. The best example one can think of is of Bajaj Finance Ltd.
The price correction in the stock is more than 50% from its peak.
What is Time Correction?
Time correction is when there is a very long and extended period of no significant price movement either on the upside or on the downside.
The stock consolidates, but there is no direction even after a very long and boring consolidation.
Similar to a price correction, time correction also happens for many reasons.
However, the reasons are a lot different. The primary reason for time correction in the stock market is lack of growth—moreover, other reasons like when stock has run up too much well ahead of expectations, etc.
The best way to envision time corrections is with the help of charts. So let us look at some of the time corrections.
Time Correction Examples
Companies with meager to no year on year growth are often found to be in the time correction mode.
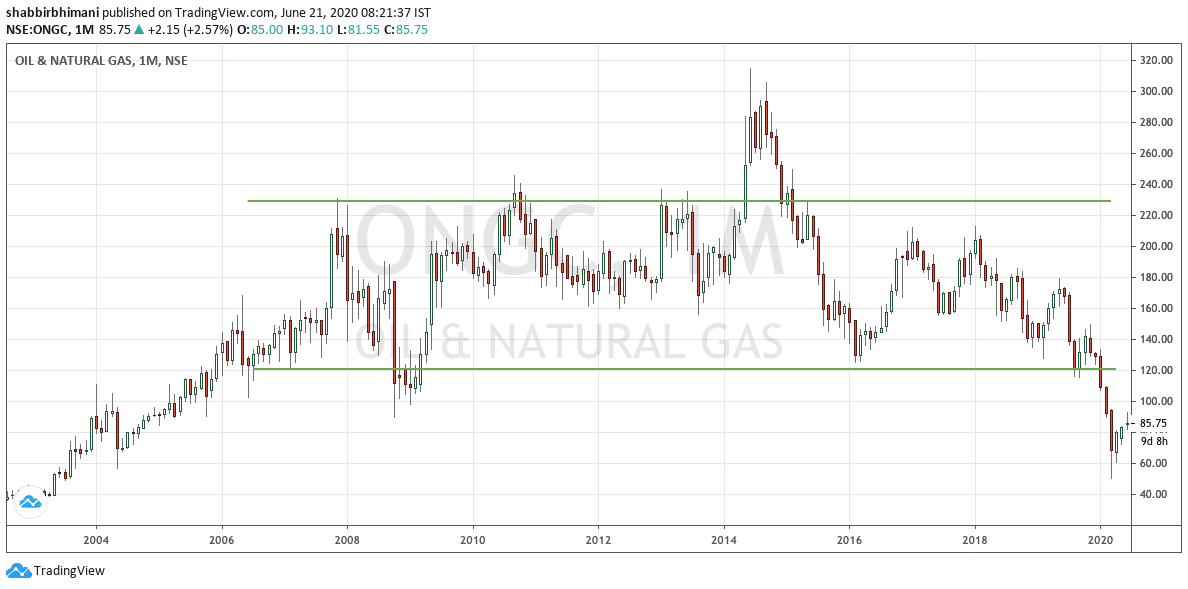
ONGC was in the range of 120 and 230 for a decade or so.
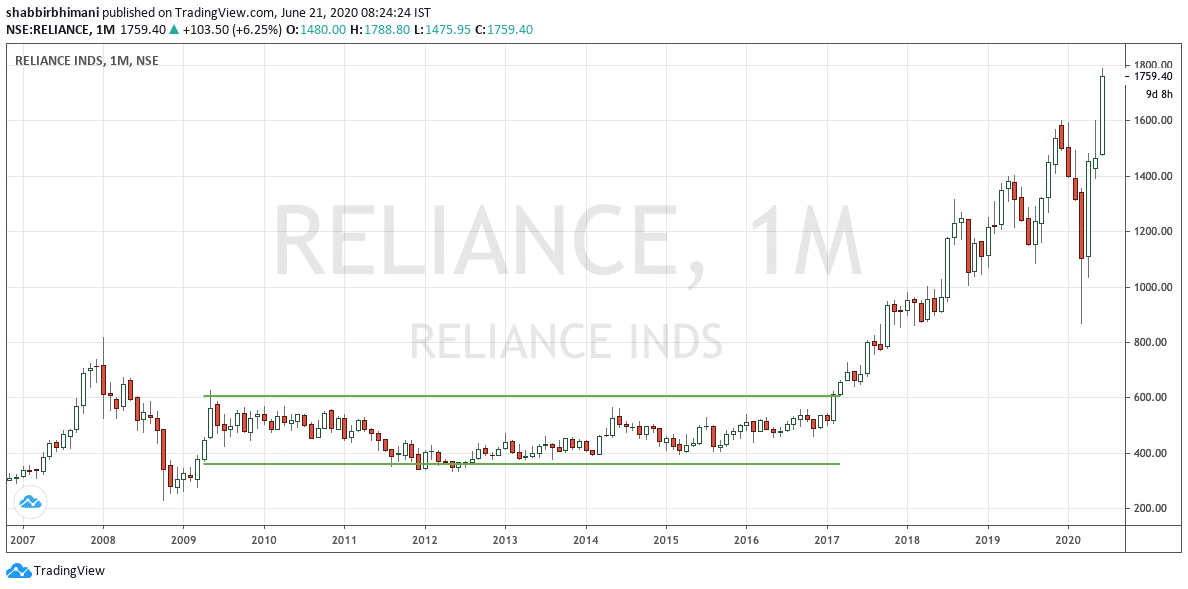
Reliance Industries is the stock of 2020. However, pre-2017 we see a time correction in the stock for almost a decade between 2007ish and 2017.
Once we look at the above charts, we find time correction only happens with stocks that lack growth.
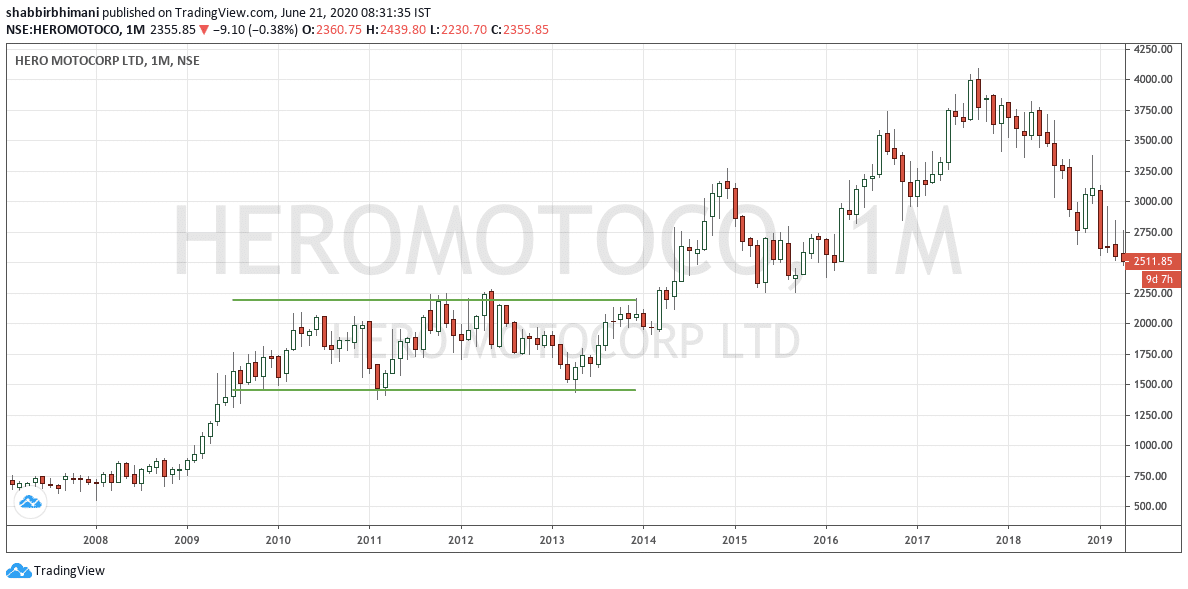
However, the reality is, time correction often happens when stock runs up too fast too soon as well.
Here is a chart of Hero Moto Corp. Stock tripes in just over a year around 2009 from ₹700 to ₹2100. Then from 2010ish to 2014, the stock shows a time correction between ₹1500 and ₹2200.
A time correction of 4 years.
Final Thoughts
There are stocks where we see an elongated time correction. However, it is a gold mine for traders because they know and trading range.
As investors, they are to be invested at the right time or better to avoid them.
Moreover, I will also recommend you to check out The 3 Attributes of Stock That Fall the Most in Corrections.



Leave a Reply