Everything a trader and investor need to know about the ascending triangle chart pattern along with real-life examples
An ascending triangle chart pattern is created from the price movement forming a horizontal line using the swing highs and up trendline using the lows. The two lines tend to form a triangle, and more often, the ascending triangle has a breakout on the upside.
The ascending triangle is a consolidation pattern within the longer-term uptrend, and it provides ample time for entry, a trailing stop loss level, and target levels.
Examples of Ascending Triangle Chart Pattern
Let us look at a few examples of the ascending triangle chart pattern to understand the pattern better.
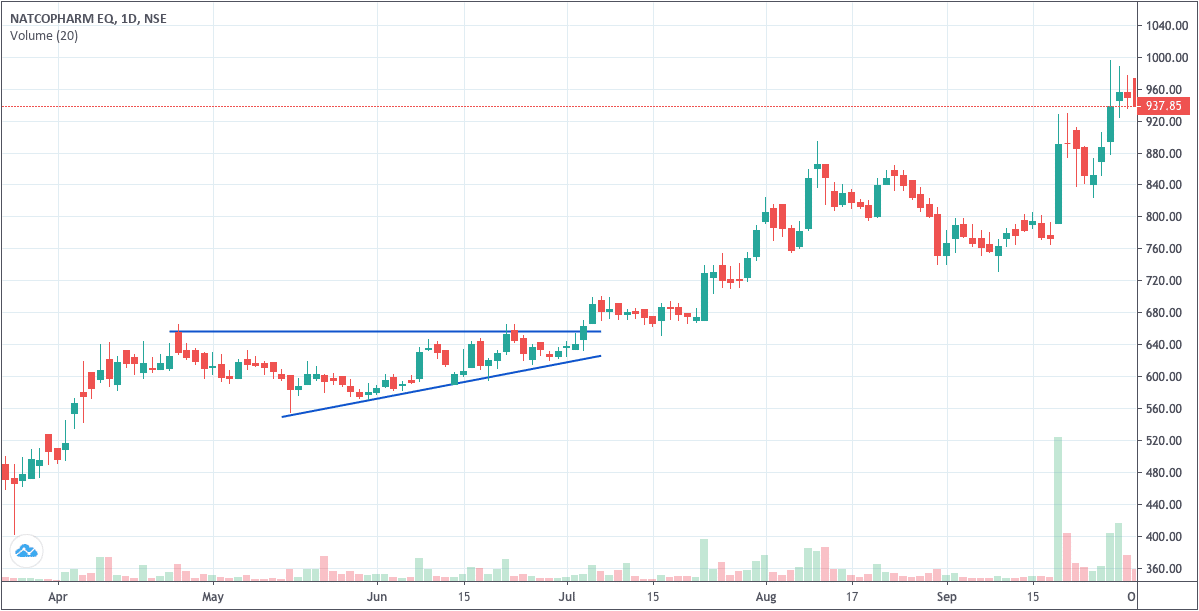
First, let us look at the daily charts of Natco Pharma, where I have marked an ascending triangle with blue lines.
You can see the up trend line drawn joining the swing lows. The resistance level is shown with the horizontal line.
The resistance level can be a line, or it can be a region as well.
Now it is a matter of time before there is a breakout above the resistance level.
The stop loss is a daily close below the up trendline.
However, at times, the pattern may not break on the upside. Most of the time, it happens if the ascending triangle formation isn’t after a pre-uptrend.
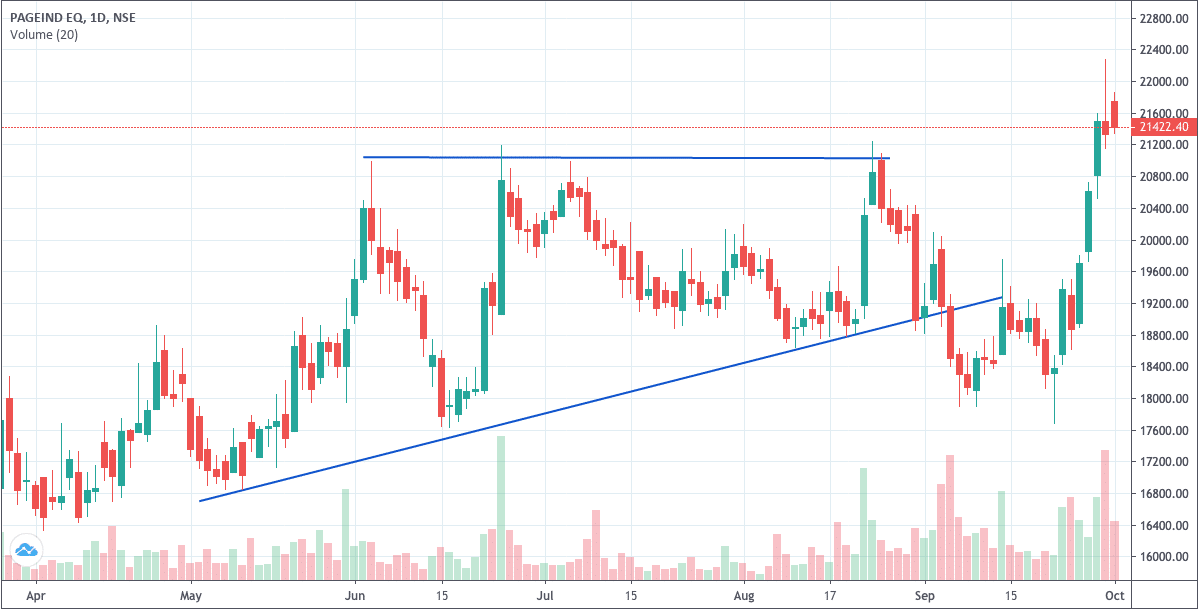
Here is the daily chart of Page Industries, where we see an ascending triangle, but then it breaks the low of the triangle’s up-trending baseline.
How to Effectively Use Ascending Triangle Chart Pattern?
An ascending triangle is a consolidation pattern within an uptrend. So, the way to find it is to look for short-term consolidation within a long-term uptrend.
Moreover, one should always keep a tight stop loss of close below the bottom trend line as it can mean you may have misread the pattern or the pattern itself has broken.
As in Page Industries, we see that the result far worse than even the lowest expectation broke the pattern. Better than expected results would have meant the continuation of the pattern.
Once you have an entry and the stop loss, the target is either as much as the stop loss amount or 1.5 to 2x the stop loss amount. Here is my way of calculating stop loss and targets.
Final Thoughts
I will recommend you to try and find some ascending triangle pattern. It is easy to spot the pattern, and it helps me invest in stocks in small quantities over a few weeks, where I know breakout is round the corner.
If one can identify the pattern, it can help them invest in good companies in the uptrend but going through a small consolidation.
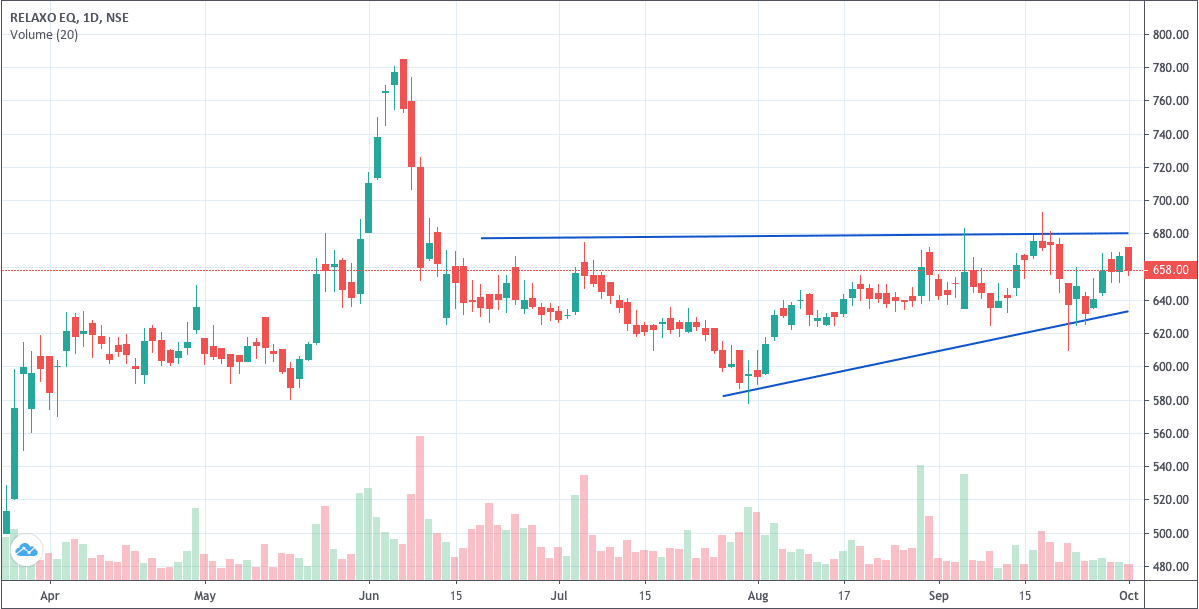
Here is one more chart where I expect the ascending triangle pattern will break on the upside.
Find at least a few ascending triangle chart patterns and share them in DIY forums or in the comments below.


Hi, Shabbir,
Ascending Triangle Chart Pattern is some kind of Breakout pattern?
What is the difference between both these pattern?
Thanks for Relaxo information
https://uploads.disquscdn.com/images/4e482bd54e7db6893561aa3d2b535342c2ba5973ee0e10eaa6a74019b0c997ce.png
Dabour chart for Ascending Triangle pattern forming is ok ?
Yes but then it is more like higher top higher bottom because the top is not horizontal.
ok. got it. resistance is not horizontal level..plebe see bata chart. hope this is ok.
https://uploads.disquscdn.com/images/0d14d9a35b17b0bf99ae1566dcb478bd1196e41f730890f53f4ebbda8a8978bf.png
Only for study purpose.
Yes but then breakout is at a later point but one can enter earlier in the ascending triangle pattern.
ok, i went to your book and learn again that part, true we can enter before breakout in this pattern.. thank you for clearing this doubt. i noted in your book you have in depth knowledge in technical analyses and your stop loss information is practical oriented…thank you
The pleasure is all mine.