Everyone knows EPS is earnings per share but how to use it effectively to invest in stocks? What if I say Page Industries is one of the cheaper stock to invest into?
What is EPS?
EPS we all know is earnings per share. In simple terms, the total earning of the company in the past 12 months divided by the total number of shares will give us the past 12 months earnings per share.
There can be a couple of types of calculations for an EPS. One is trailing twelve month EPS, and other is EPS of the company for the last complete financial year also known as annual EPS.
- Annual EPS is the earnings per share of the company for last fiscal or last financial year.
- Trailing twelve month EPS also written as TTM EPS is the sum of earnings of the last four quarters.
After the March quarter results, the TTM EPS is the same as the annual EPS.
We also have consolidated EPS and standalone EPS.
A company can be a single entity, or it can be a composition of many subsidiary companies operating in a variety of business or various GEO.
Consolidated EPS is when we consider the company and all its subsidiaries. Standalone EPS is when we use only the parent companies earnings.
As an example, Tata Motors India has India operations as well as Global operations. Standalone EPS is for India operations that are taken up by Tata Motors, but when considering all its subsidiaries operating in all GEO, we get the Consolidated EPS.
As an investor, I always consider the consolidated EPS and not standalone EPS.
We shall consider the consolidated EPS for all the subsidiaries companies, but some companies listed in India are a subsidiary of the parent company. For example, Hindustan Unilever or HUL where the parent company Unilever holds a stake in the company. Here we will consider the Hindustan Unilever and its subsidiary companies and not the parent company Unilever.
How to Use EPS to Invest in High PE Stocks?
Investors go about using PE or price to earnings ratio for investing in stock. So lower price to earnings ratio as compared to its peers the better.
Again, it is one of the better ways to understand the relative valuations of the company but when it comes to high PE, high growth stocks, I like to calculate differently.
I do the calculation as follows:
If I am buying a company for a particular price to earnings, how many years will the company need to convert the current EPS to the price I am paying per share today, assuming the company can maintain the average EPS growth rate of past five years.
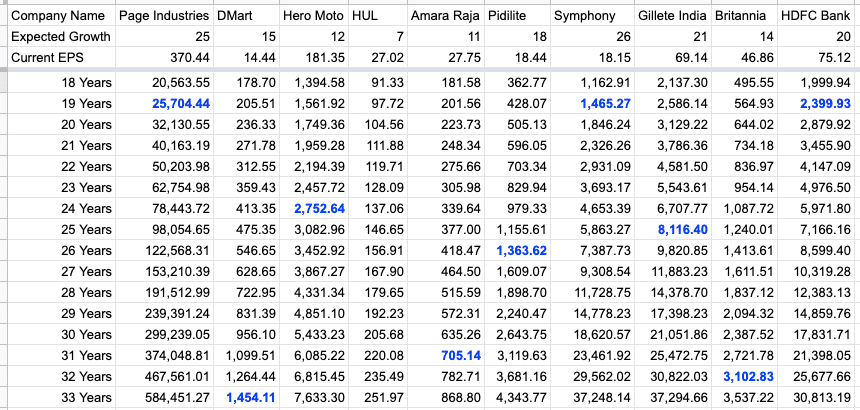
So for example as per Investello, Page Industries has a TTM EPS of ₹370.44 with an average EPS growth for the past five years of 25%.
So if the company continues to grow at 25% for the next 20 years, it will reach an EPS of 25k.
Again, growing at that rate for the next 20 years will be tough. So what is the probability it can achieve the same?
The higher the probability, the better.
So if I put the same calculations on other companies, some companies get the EPS to the current prices very far down the road.
As an example, HUL It has an EPS of ₹27 and EPS growth of 6.35% for the past five years. It is currently trading at ₹1700. So it will need 60+ years to reach an EPS of ₹1700.
Britannia with an EPS of ₹47 and EPS growth of 14%, it will reach an EPS of 3k in 35 years.
Hero Moto Corp has an EPS ₹181 and EPS growth of 12%. It will reach ₹2600+ in 25 years.
In the above screenshot, blue cells represent the EPS after N years when the company will reach an EPS equal to the current share price.
As we can see, Page Industries, Symphony or HDFC Bank will reach the current price as EPS in 19 years whereas other stocks like DMart or Britannia will need a lot more time.
Remember one key point, we assume the past rate will continue for the next 20 years, but in some cases, the growth rate may increase as well. Like in DMart, the expected growth rate is more than 20% among investor, but I have used 15% in the formula.
One more observation is the PE ratio of Hero Moto Corp or Amara Raja Batteries at current year earnings is under 15 and 25 respectively. Both will need 25 to 30 years to reach an EPS they are currently trading.
Here is the Google sheet for the above formula. Make a copy of the Google sheet and apply the same method to any stock of your choice.
The Critical Aspect of the above Calculation
I like to invest in companies when I find EPS will reach within the next 20 to 25 years. If it is more than 25 years, I want to avoid unless I plan to invest for more than 25 years.
Again, this is how I prefer but feel free to innovate your way to calculate.
The above method is more to give an idea of what price we are paying for the company and when the company can earn the amount we are paying now. The stock will trade at many multiples by then as well, but it is for the sake of making relative calculations of high PE stocks.
Page Industries 10 years back was trading at ₹350 at the time of IPO, and now it has an EPS of ₹370.
Whatever calculations one uses, don’t forget the most critical question – Can the company and the management keep the growth rate going in the future for such a long period as well?
Over to You
What are your thoughts about the way I interpret the EPS? I am no guru and will be more than happy to learn from your views as well. So please share them in comments below.
Let’s help each other interpret the EPS in a better way to help invest in high growth companies at a better price.


Sir – Thanks for sharing this insight. That’s a very simple analysis that everyone can understand. Just one question that came to my mind – how do you see this being applied to large caps vs mid/small caps? Do you think it equally applies to all the stocks or would give better results if applied to large/mid caps with proven historical performance? This is because the fundamental assumption of this analysis is that the historical growth rate(s) may continue into the foreseeable future.
It is applicable to stock where you have high PE stock which are typically large cap / mid caps but very often not small cap stocks. Again, this is not the only way to apply thing but then it is one of the better way I find to apply it.
sir you should have more column to estimate the expected market price with growth & EPS .
Market price prediction is based on technical analysis. Also 20 years down the line how will market react can’t be predicted but one can predict the quality of business based on the integrity of the management.
Thanks Shabbir for that article, its made so easy to understand I already sent it to my friends
Thanks again
The pleasure is all mine and thanks for sharing.
Why not consider the summation of EPS for each year and then see when it will be equal to the price we pay now. Because we remain invested and so we derive lot of dividends based on its earnings as well as the total of the earnings is equal to what we have paid.
That is a good way to calculate as well. Total earnings of the company equals to the price one is paying now.
This is such an innovative way to look at the EPS. Actually it is earnings and so when the earnings will be equal to the price is quite good way to look at things. So much new things to learn all the time from your blog. Keep up the good work.
Glad you like ti Vivek.