Everything to know about Lower Top Lower Bottom Chart Pattern – What it is? Why does it work? Is it Only for Traders? Real Examples
We saw a Higher top higher bottom indicates the underlying strength in the stock. Similarly, the lower top lower bottom shows weakness.
Again, much like higher top higher bottom patterns, one may assume the lower top lower bottom pattern is for the traders, but it isn’t.
Investors can use it in two different ways.
One of them is, of course, to book profits and move to some other stock for investment.
The other meaningful way of looking at the pattern is in great companies’ bad news can trigger lower top lower bottom formation. However, it will always have a consolidation pattern to follow. So, an investor can start accumulating cash to invest in the stock when the consolidation pattern materializes.
My investments in Lupin was based on the lower top lower bottom formation in the stock for its USFDA issues before 2017. We will look into it as an example of investment.
Things went differently from my initial assumptions. Still, as the company was doing the right things, I remained invested.
So without much ado, let me begin explaining the pattern.
What is Lower Top Lower Bottom Chart Pattern?
If the high of a peak is lower than the previous high of the last rise and the low of the trough is lower than the previous low of the trough’s, it is called a lower top lower bottom chart pattern.
From the Higher Top Higher Bottom pattern, we know there are many market participants, and each reacts differently to a particular set of news.
So assume the stock has all the bad news coming and so there will be a fall.
Now there will be short term traders who are short will cover, and they will drag stock higher. Again, this will drive more people to sell, making it lower.
Furthermore, many new short sellers will jump in and take the stock further down.
Is Lower Top Lower Bottom Pattern Only for Traders?
I don’t think so.
When I want to book out of a company, the formation of the lower top is the zone when I prefer to book out even for my long-term investment portfolio. As I am selling in the leg up, it helps me make some extra money.
So when the stock price moves higher, I like to exit.
Similarly, when I know there is a formation of lower top lower bottom in a company that I always wanted to invest in, I like to start accumulating cash.
Real-Life Example of Lower Top Lower Bottom Pattern?
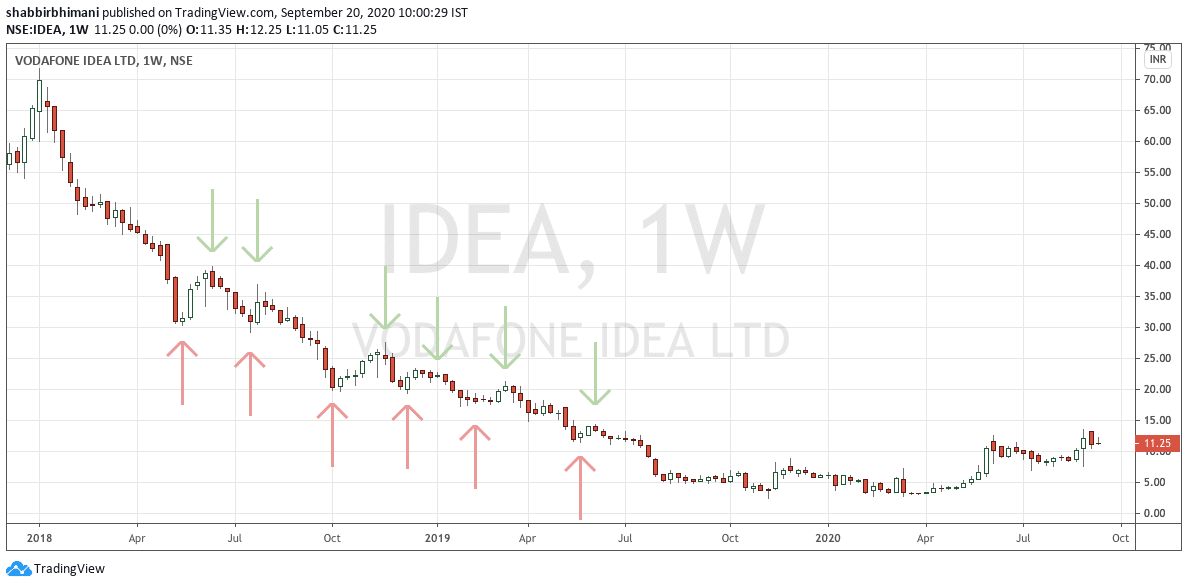
Here is the Weekly chart of Vodafone Idea.
Red arrow and green arrow alternates. Further, there is a plunge below the previous low.
I have chosen the Voda Idea because I get this query often about the stock.
We see there is a lower top lower bottom formation. The survival of Voda Idea was in question when it was forming that lower top lower bottom formation.
Still, there was a rise in the stock price. Now you can visualize why.
There were market participants short on the stock and covering, but the buyer will never exceed the number of people who wanted to offload.
Again, one crucial aspect to observe in the above chart is there is a consolidation. The process of incremental bad news for the company has stopped flowing in. So the selling pressure may have eased.
The buying will return only when things turn around in the business, and it looks tough to outpace JIO now.
So clearly, this is a total avoid type of stock, but then we can learn something good about the lower top lower bottom chart pattern.
My Investment in Lupin Based on the Pattern
As an investor, the lower top lower bottom formation will happen in stocks, with a series of bad news coming.
However, if you are confident the news flow is a matter of a few years, and it will end at some point, you can invest in it. The critical aspect is to do the due diligence about the integrity of the business and the management or has taken the right financial advice.
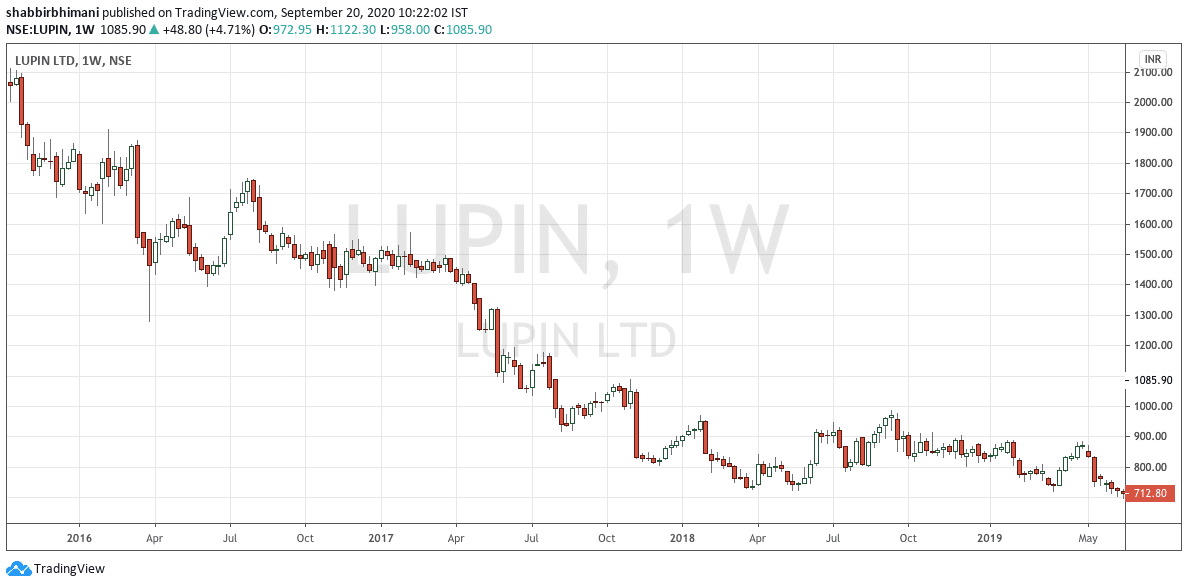
Here is the weekly chart of Lupin from 2016 to 2019
From the high of ₹2100, it collapsed to almost ₹700. Every bad news about the company for the USFDA issue was in the price, which is when consolidation started to happen.
I invested in the stock at that point.
However, the company made some bold decisions about selling off some non-performing businesses in Japan and paying fine for some of the cases. Financial performance became weak, and the stock did plunge further. However, those were one-offs.
So lower top lower bottom does mean you can do the research about the company and invest at the right price. However, it requires a lot more effort to identify a great company and then have the patience if further negative news comes up.
So the lower top lower bottom pattern is not for the faint-hearted investors and only those who can do the research in a company and remain invested and take the call that things will improve as the company is doing the right things.
Final Thoughts
Often, for my style of investment, I prefer to average up vs. average down, and so lower top, the lower bottom isn’t the first choice of investing. However, in some cases, I do invest.
However, as a general note, the stocks discussed in the article aren’t a recommendation but are for understanding the chart patterns with real examples.


Leave a Reply