Understand Rectangle Chart Pattern to calculate target and stop loss from support and resistance for both bearish and bullish rectangle
A rectangle chart pattern is formed when the price oscillates between horizontal support and resistance levels. The price will “test” the support and the resistance levels several times before eventually moving out of the range and break out.
In an uptrend, the formation of a rectangle can mean an intermediate top followed by a trend reversal or a continuation of the uptrend. It can mean a formation of the bottom in a downtrend, followed by a trend reversal or continuation of the downtrend.
There are no indicators within the rectangle to help predict the side of the breakout. So it is wiser to wait for the actual breakout to occur than to assume one.
However, if one can use the concept of fundamental analysis or overall market or sectorial trend, one can take a position within the rectangle’s boundaries. However, one should take a position with a lot of precautions.
Examples of Rectangle Chart Pattern
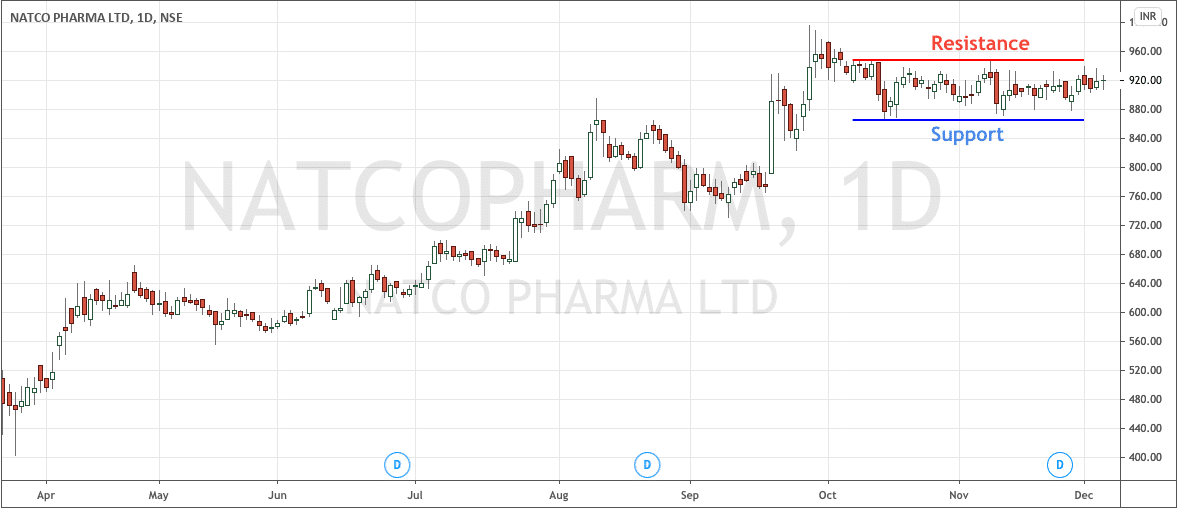
In the daily charts of Natco Pharma, we see the formation of a rectangle chart pattern.
Chart by Upstox
The stock, after hitting the low of ₹400 in March 2020, started moving higher. Now in Nov2020, the stock price is oscillating in the range of ₹866 to ₹950.
I have taken the stock that is forming the rectangle to explain the point I was making about fundamentals, sectorial view, and market trend.
One can take a long call on the stock based on the view for the business of Natco Pharma or Pharma sector as a whole or market in general.
However, in a rectangle chart pattern, the best is to wait for the breakout to happen as rectangle often can be long and boring to wait out.
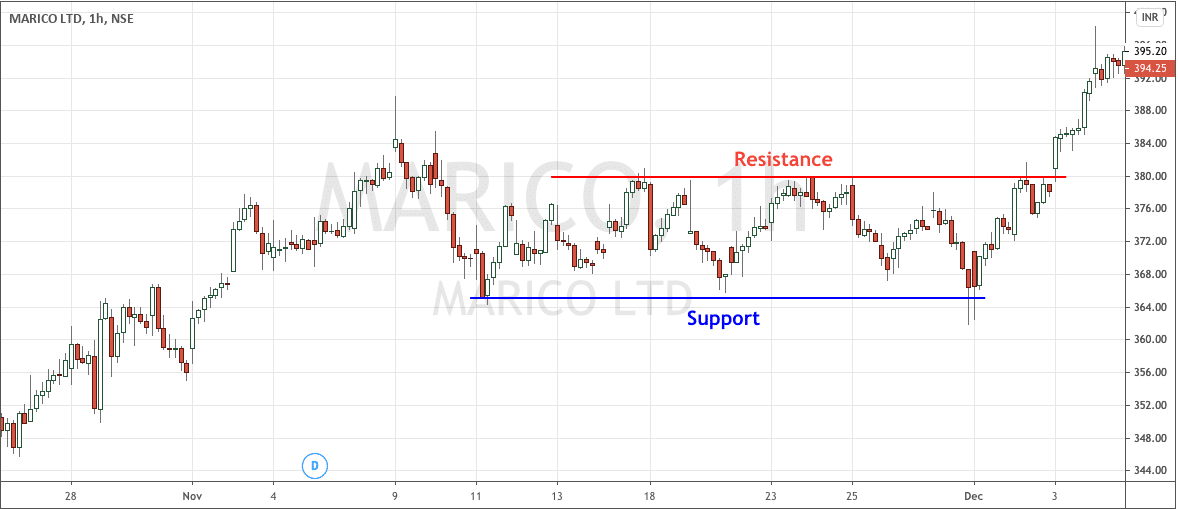
Here are Marico’s hourly charts, where we see the formation of a rectangle chart pattern and a breakout on the upside.
Chart by Upstox
Calculating Stop Loss and Target Levels
The most crucial aspect of any trading chart pattern is to be able to calculate a stop loss and target.
The calculation of stop loss is pretty simple. The support level is the stop loss, and a close below the support level indicates that stop-loss is hit.
The target calculation is pretty straightforward, as well.
The target is the same as the range of the rectangle from the breakout point.
Let me explain it with the example of Marico.
The Support is at ₹365, and the resistance is at ₹380.
So the range of the rectangle is ₹380-₹365, which is ₹15.
So the target will be ₹15 above the breakout of the resistance level of ₹380, which is ₹395.
Now I will suggest you come up with the target price in the case of Natco Pharma and share them in the comments below.
What is Bullish and Bearish Rectangle?
At the start, I did mention that there are no indicators within the rectangle to help predict the breakout’s side.
However, there is a high probability that rectangles will continue the prior trend.
It means the formation of a rectangle in a downtrend means it is more likely that the prior downtrend will continue than the bottom’s formation. However, for the downtrend to reverse, one needs a more specific trend reversal pattern like rounding the base.
So a rectangle formed after a downtrend is referred to as Bearish Rectangle.
Similarly, after an uptrend, there is a high possibility the rectangle will break out on the upside and resume the uptrend.
So a rectangle formed after an uptrend is referred to as Bullish Rectangle.
Trading Within the Rectangle
One can also trade within the boundary of the rectangle as well.
One can buy at the support level and sell at the resistance level. For such trades, one can have a stop loss of 2% lower than the buy price.
Similarly, one can wait for the breakout or sell at the resistance levels and then wait for the breakout to retake positions or buy again at the support levels.
Final Thoughts
The rectangle chart pattern is one of the basic technical analysis patterns with clear support and resistance levels.
One can trade go long at the support and cover at the resistance level or buy at the breakout.


NATCO Target price 1,034
Awesome. Now let’s see when it hits that mark.