How to read candlestick for trends. Understand different types of candlesticks. What is a shooting star candlestick, understand DOJI and pin bar candlestick
What is Candlestick
The charts comprise of colored rectangles. Each rectangle represents an elapsed timeframe, which can be as low as one minute to as high as one month.
In the chart, each rectangle shows the open, high, low, and close price for the chart’s timeframe and is known as a candlestick.
Here is the daily chart of Nifty from TradingView.
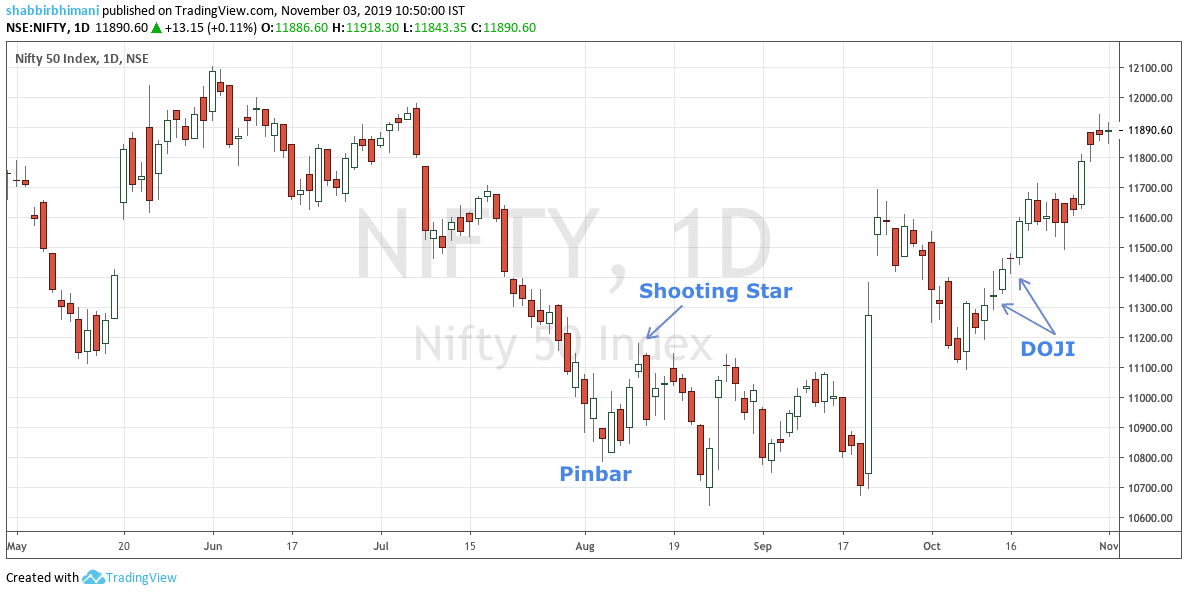
So the timeframe in the above chart is daily. So it means each rectangle represents the trading activity of one day.
Understand Open, High, Low, and Close in Red Candlestick
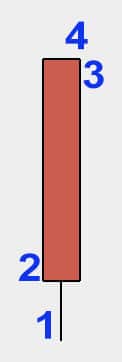
From the above chart, let me zoom out a red triangle, also known as a red candlestick.
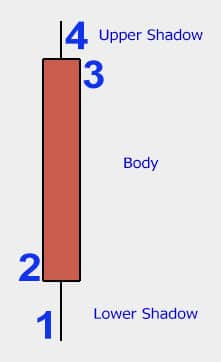
There are points marked from one to four. Let’s see what they mean in each candlestick in the chart above.
- It is the low of the price represented by the timeframe in each candlestick. In our case, as the chart is a daily chart, it is low for the day. For an hourly chart, it becomes low for the hour.
- The close of the price represented by the timeframe in each candlestick.
- The open of the price represented by the timeframe in each candlestick. Because the candlestick is red, open is higher than the close. In the green or white candlestick, the open and low swaps position as we will see it in the example below.
- It is the high of the price represented by the timeframe in each candlestick.
Understand Open, High, Low, and Close in Hollow or White Candlestick
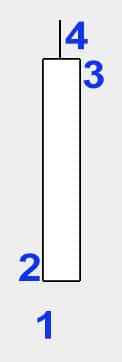
Let us now look into a white candlestick.
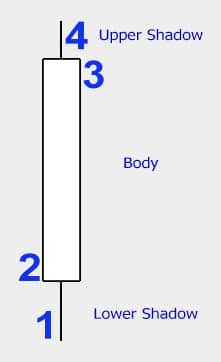
There are points marked from one to four. Let’s see what they mean in a candlestick.
- It is the low of the price represented by the timeframe in each candlestick. In our case, as the chart is a daily chart, it is low for the day. For an hourly chart, it becomes low for the hour.
- The open of the price represented by the timeframe in each candlestick.
- The close of the price represented by the timeframe in each candlestick. Because the candlestick is white, close is higher than the open.
- It is the high of the price represented by the timeframe in each candlestick.
What is Body of Candlestick?
The red or white portion of a candlestick, as shown in both the above figure, is known as the real body of the candlestick.
What is Upper and Lower Shadow of Candlestick
The point 1 and 4 in each of the above candlestick, aka red and white represented by a black line, is known as the shadow of the candlestick.
The shadow on the upper side is known as the upper shadow of the candlestick. Similarly, the shadow on the lower end is known as, the lower shadow of a candlestick
Formation of Different Types of CandleSticks
Many different kinds of candlesticks can help read and identify trends.
Same Open and Low
Open at the low but doesn’t cross the low in the timeframe of the candlestick.
In a daily chart, it opens at the low. However, during the entire day of trade, it doesn’t cross the low made at the open.
Same Open and High
Open at the high but doesn’t cross the high in the timeframe of the candlestick.
In a daily chart, open is at the high, but during the entire day of trade, it doesn’t cross the high made at the open.
Same Close and Low
Close at the lowest point.
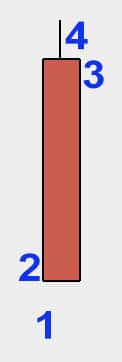
In a daily chart, it is quite rare to have a close at the exact lowest point of the day but often close very near to the low.
Same Close and High
Close at the highest point.
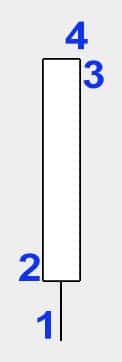
In a daily chart, again, closing at the highest point may be rare, but very near to the high is a possibility.
DOJI Candlestick
When Open and close are the same or very near to each other. They are so close that there is a tiny body of a candlestick.
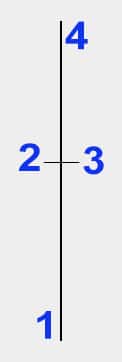
May not have a long shadow and often looks like a plus or cross and commonly known as DOJI candlestick.
Shooting Star Candlestick
Three things should happen for a shooting star formation:
- Open and close are very close to each other.
- There is a vast upper shadow.
- There is minimal to no lower shadow. So the body is near the bottom end.
The significance of a shooting star is, there was a huge demand, which leads to the price rise. However, there is immediate selling pressure signifying an end of an uptrend.
In the daily chart of Nifty, the shooting star is followed by a mild correction.
Pinbar Candlestick?
The Inverted shooting start candle is often known as a pin bar. It also has all the three components of a shooting star.
- Open and close are very close to each and other.
- There is a vast lower shadow.
- There is minimal to no upper shadow. So the body is near the upper end.
Similar to a shooting star, the significance of a pin bar is a considerable selling pressure followed by strong demand. It signifies an end of a downtrend.
In the daily chart of Nifty, the pin bar is followed by an upswing.
Final Thoughts
Pinbar and shooting star candlestick can signify a lot of things and can help identify an intermediate trend reversal. Again, for trading, there are many more signals one should combine. Moreover, as a general disclaimer, the above information is only for educational purposes.



wanted to end 2019 by reading ur book but seems bhagwan chahte nahi hai. Article hi aab ek sahara hai.
Kyun bhagwan nahin chahte hain?
so much work whever get time i brwose articles only.
You have to find time for your education. Life will always be a drift but you have to pull it along to where you want it to be.
Thanks. I like it.
Glad you like it.