
Support and resistance levels are very critical to not only trading in the market but also for investments. So let’s calculate the support and resistance levels.
Support and resistance levels are the most crucial aspect to understand when trading or investing in the market. You read it right, and it is not a mistake. Even when investing.
The complete support and resistance topic is beyond an article, but I will try and make it compact and explain the support and resistance level as well as cover some of the common myths about it. The topic is covered in detail in the book Right Stock at Right Price for Right Time.
So instead of making it a post of book promotion, let us now begin and understand support and resistance levels.
What is Support and Resistance in Trading?
To put it simply, the support is the demand zone, and resistance is the supply zone.
This one line should explain everything you need to be knowing about support and resistance levels when trading in the market.
So now, if we apply the basic concept of demand and supply, it is easy to predict. From a demand zone, the stock price should increase. Similarly, from a supply zone, the stock price should decrease.
So a support zone is the price point where stock doesn’t fall beyond a particular price level.
Similarly, the resistance level is the price point where stock finds tough to go past it.
Support and resistance level is a fairly simple concept. The problem is, traders make it complicated when calculating the support and resistance level.
The 200DMA acts like magic, and the reason being, at 200DMA, there is a demand in the correction of an uptrend and supply in case of correction in the downtrend.
Calculating support and resistance isn’t as complicated as it may sound, either. So let us now do the calculations.
How to Calculate Support and Resistance?
There are many ways to calculate support and resistance levels. 200DMA is one of them.
My view is, the most reliable of all calculations is the price action strategy. Within the price action strategy, there are 4 to 5 patterns that one can use to calculate support and resistance levels.
I will share one of them here, and it is using the support and resistance trend-lines.
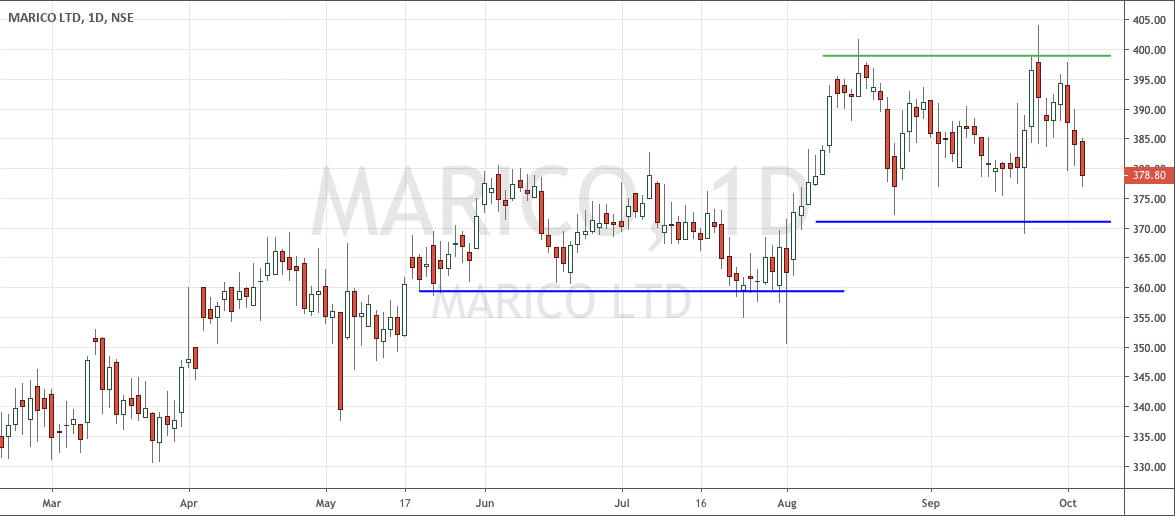
I will use the same daily chart of Marico I used in my previous article for understanding the target levels.
Blue lines indicate the stock is not willing to break these levels.
If one is specific about the shadow of candlesticks, there is a price range that stock is not willing to break. It is ₹350 to ₹360. So, it is the support zone for the stock.
Similarly, the green line is the resistance level for the stock. Stock is trying to get past it but is not able to do it.
It will need a piece of good news in the form of earnings or something else to get past the significant resistance level. Similarly, on the downside, the stock needs an awful result to break the significant support level.
I know the support and resistance calculation above seems too simplistic, but it is the reality. The calculation of support and resistance level is straightforward if one knows how to do it.
There are other patterns to find support and resistance levels like Cup formation, Flag formation, Round bottom pattern, Pivot point calculations, etc. All are very simple and easy to understand.
What do Support and Resistance Tell You?
There is very little that changes on a minute to minute basis in the fundamentals of the company.
However, the sentiments of the participants, aka trader and investor for stock at a particular price point, keep changing.
The bad news can have a ripple effect, and the stock prices fall like a pack of cards. The traders will always be with the trend. At some point, the investors find value at a price and start accumulating, forming a support zone.
Similarly, good news can form the same ripple effect on the upside. Traders jump in to trade with the trend. At some point, the investors find the price to be way above the value. Traders and investors booking profit form a resistance zone.
To break the support, one needs investors to stop accumulating as well as the traders to stop covering the short positions and vice versa for resistance.
Good earnings mean resistance is taken out because investors aren’t willing to sell at elevated prices anymore, and traders are in no mood to cover their long positions. Similarly, bad news makes the support to breach.
So the earlier support and resistance tells us how the news flows may have been without even consulting any newsroom.
Similarly, if one expects the future support or resistance levels to be taken out, the same type and kind of news flows may be needed.
What are the causes of Resistance?
The only cause of a resistance level is supply. There can be various reasons for the supply, and I will share some of them.
So if a big brokerage house has a target price for a stock at a key level like, for example, in the above chart of Marico, we see ₹400 as a key resistance level. It can mean some large investors are willing to offload the stock at that level.
With resistance level in view for the traders, most positions trader take will have target under ₹400.
The cause of the resistance level is always the supply. The reason for supply can vary from stock to stock as well as fundamentals of the company to technical analysis and chart patterns.
What are the causes of Support?
Similar to resistance, the only cause of the formation of support is demand. There is no other reason for the formation of support levels or support zone.
The reason for a demand in particular stock can vary. One of the reasons for the demand is the price, which is value buy for the investors.
Do Support and Resistance Work?
Do supply and demand work? If your answer is yes, the answer to whether support and resistance work is also yes.
The reason we have this question is that the flaw in the calculation of support and resistance levels.
If you are miscalculating the support and resistance level, you may get the feeling, the support and resistance levels don’t work in the market.
So if support and resistance level don’t work for you, it is time to reconsider the calculation you are doing for it instead of doubting if support and resistance level work or not.
What happens when a stock breaks Support Zone?
When a critical support level breaks, the stock will have a free fall for sure.
Here is the weekly chart of Amara Raja Batteries, where the key support level shown with a blue line.
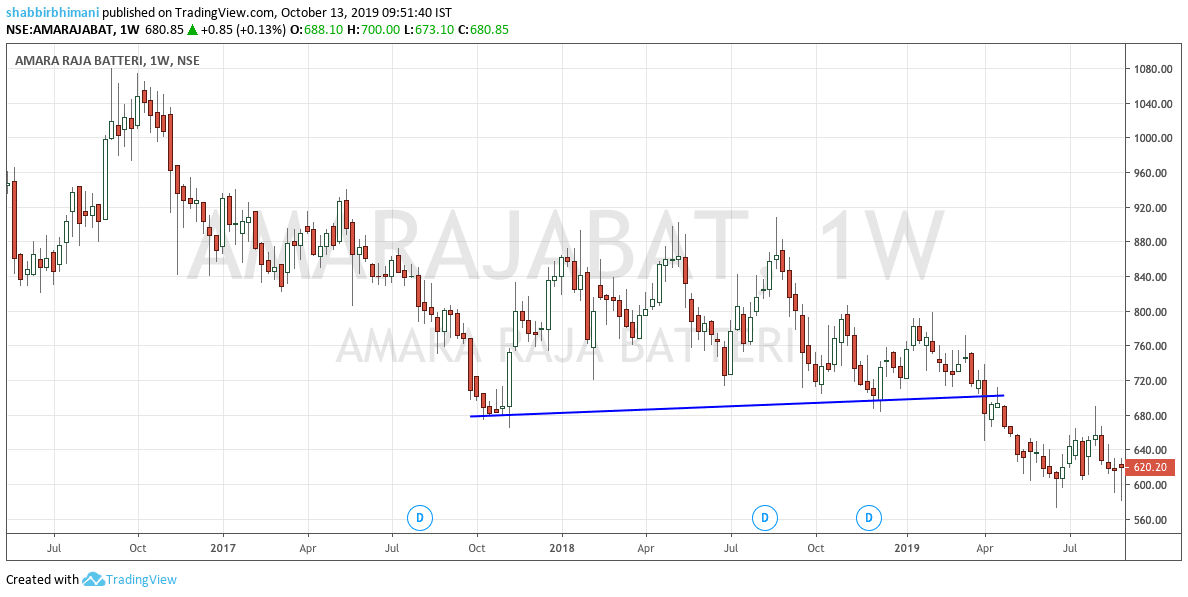
The support is around ₹700 on a weekly chart, which means it is a significant support level. As it breaks, the stock free fall to ₹575.
And then Support Becomes Resistance.
The reason for the fall is supply. The supply is vast because the bad news makes the investors go in the wait and watch mode. Long traders hit the stop loss and square off the position giving additional supply. The short sellers jump in to cash in because the critical support zone has been violated.
All in all, when support breaks, the free fall is inevitable.
What happens when a Stock breaks a Key Resistance Level?
When the critical resistance level is taken out, it can mean the stock can have a significant uptrend.
Here is the daily chart of Zydus Wellness, where key resistance level shown with a green line.
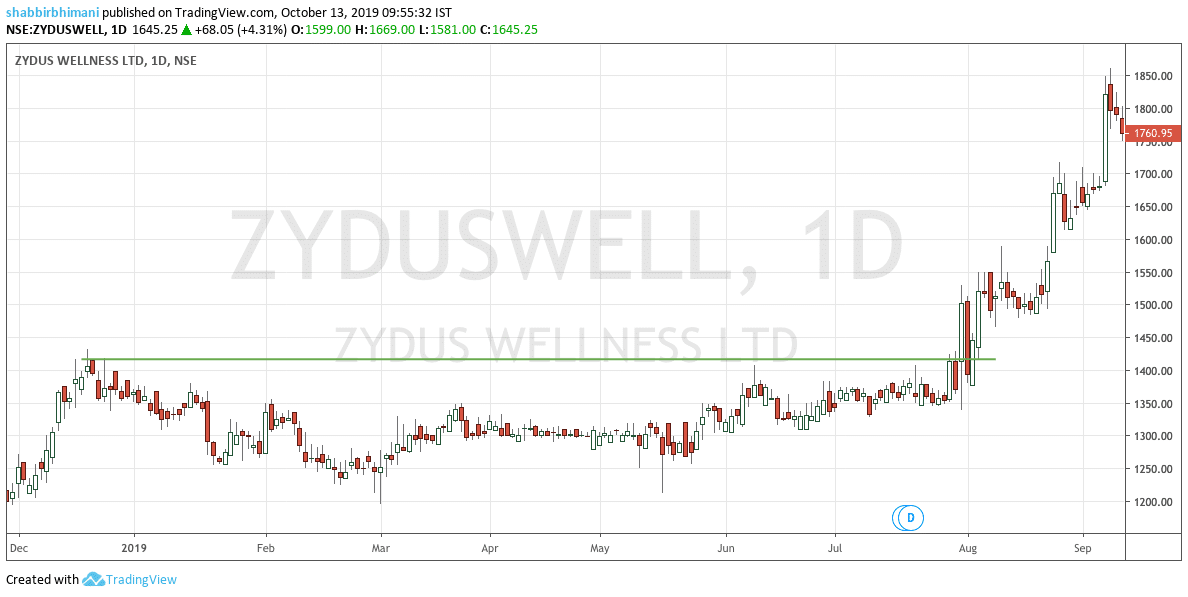
When the stock decisively moves above ₹1400, there is no stopping for it before ₹1850.
In nine months, the stock is trading between ₹1200 to ₹1400, but when ₹1400 is taken out, it reaches ₹1800+ in over a month.
The power of resistance when taken out.
Final Thoughts
There are chart patterns to trade with support and resistance strategy. They help in calculating the support levels, which acts as a stop loss and resistance levels to guide us with targets.
I hope the article helps all Indian retail investors to understand the support and resistance and apply it to trading as well as investing in the market.
I am sure you will have more questions, and I will be more than happy to answer them all for you. So if you have any further questions, feel free to ask them in the comments below.

Shabbir one request can u plzz throw more light on 200DMA, –i.e 200 Downward Moving Average how to use it & how to see it.
Have it more here https://shabbir.in/200dma/
Let me know if it helps or you want even more.
Nice one Shabbir. Very nicely explained.
Bought ur Book from Amazon haven’t read yet not getting time. Have dozen of books to read.
Thanks for the Article it has reduced my Workload.
The pleasure is all mine Hari. I hope you like my book as well.
Which chart to follow for support and resistance, weekly or 1day chart, if one does intraday trading?
For Intraday trading it should be mostly in hourly charts.
Hello Shabbir,
I am really enjoying your blog and tried to apply your formulas to some of the stocks. One of them is SBI.
SBI is trading in at 240 right now. As you can see from the attached graph, 240-245 as acted as support/resistance on multiple occasions in the last 5 years.
Now the question is, since SBI is at 240 now, should I buy it or sell it? How do I know, if 240 will act as support and hence buy for some profit or 240 will act as resistance and hence any buying at this stage will result in a loss?
What are some of the indicators to know which way 240 will act?
Utpal,
Glad you like my blog and SBI has a very good support around 220ish but then I would prefer the support to held and buy in the leg up and not in the leg down.
Again 240 was cracked this time and low is around 220 but then it is all ok as the low is not very far off from the other lows.
Also 240 is not a long term support and long term support is around 150ish levels.
If you were to invest, you have to be looking at the fundamentals of the company and I don’t see any issues whatsoever apart from the fact that it is 10% overpriced.
Thanks
Shabbir
Hi Shabbir,
I was reading about RSI above, and i tried to analyse and study the stock that i’m currently holding. “JP Associates”. When i bought the stock i didn’t have much knowledge i just bought using fundamentals and now i’m loosing continuously but still holding.
As per your point 1, i purchased JP Associates when stock was trading between 97-100 on 1st week of December. I now realize that it was wrong time to buy that stock.
1) I would like ask you that, how would i have been known about this trend situation and applied correct stop loss.
2) Also, I did some analysis using Stochastic which showed momentum above 50 and reaching 80 points but still the trend remains bearish. What one can learn from this. ?
3) When should one use RSI and Stochastic indicators?
Thanks, for this valuable information.
Hi Mehul,
I don’t use RSI when trading but my strategy is price action based strategy that I have been teaching my members. Still both RSI and price action strategy clearly suggest that 100 in December 2012 was not the right point to enter in this stock and even if you had gone long, there should have been a stop loss that could have saved you from a 40% loss.
1. Pretty basics of any strategy that you apply will suggest you that was not the right entry point. Even if you miss that, you can be easily have a stop loss and came out of it.
2. Again I don’t follow Stochastics but then again the trend is positive and target of 80 is pretty round the corner with my strategy as well.
3. This can be answered by those who use it more often in market but I would say that I use my price action strategy almost in every trade or investment that I do.
I hope it helps Mehul.
Sure, it will help me.
What i learn from this, is to have stop loss defined either for long or short.
Thanks Shabbir.
Glad to see it will help you Mehul. Yes every transaction in Market should have a stop.
Hi Shabbir,
I want to acheive the following Support levels ( 3rd March to 18th March and Resistance levels (19 to 21st March). Can you tell me if it is possible to get these figures. I am ready to pay for this.
3-Mar-14 6230
4-Mar-14 6259
5-Mar-14 6286
6-Mar-14 6330
7-Mar-14 6396
10-Mar-14 6452
11-Mar-14 6490
12-Mar-14 6519
13-Mar-14 6532
14-Mar-14 6546
18-Mar-14 6558
19-Mar-14 6569
20-Mar-14 6564
21-Mar-14 6560
There can be various methods to calculate those levels and yes, you can achieve those provided you know what calculations are used.
dear shabbir,
which software is good for technical analysis for free for indian market?
ChartNexus is really good for end of day charts but actually it is not the software that matters and any software with Good candlesticks charts is good enough.
Hi there, I have lost lots of money … Even so, I am holding on to trade again! I hope to get everything back an make a ‘comeback’ using Ur guidance … I am going to practice these support an resistance levels on a demo account an jump back in …
Sure Chris and you can always get in touch with me here with any doubts you have.
Hi Shabbir Bhimani
can check and suggest about the stock Fedders Lloyd Corporation Limited.i am holding this stock from average levels of Rs 97.Now trading around 42-46.Pls help me.Thanks You.
I don’t see any hope in this stock Kumar
Dear Shabbir,
I am presently holding 1150 shares of TataMotors bought at 4 different levels, viz., 236. 241, 245, and 251 and the stock is trading around 290 in the bourses. Can I wait for some more time to get more profit or is it time to sell off?
Please advise me accordingly. Thanks.
Hi Rajan, I don’t prefer sharing stock and exact levels but prefer my reader find those levels themselves by reading my ebook but still If I would be in your position I would hold on Tata Motors with a strict stop loss of 260.
Thanks for the information provided. Your books seems to be interesting and would like to go for it. But i have few questions and it would be great if you provide me your valuable feedbac.
1. you book mentions about charts and patterns. But my basic question is where will i find this charts and pattern. Is there any free site which provides these details?
2. there are thousands of companies listed on NSE and BSE. Do we need to make daily analysis of all the companies chart. or is there any site which provides stock screeners ie which company is forming a chart?
3. is your book available in crossword or any book market or i need to book it online only.
Please let me know your feedback
1. Yes. You can get free charts at Google Finance, Yahoo Finance or at http://chartink.com
2. Yes and NO. You can have a stock screener but then I prefer trading in my list of stocks only.
3. My book is only available in ebook format and not in paper format as of now.
when i open chartlink site, it says about SSL and cannot go into its homepage, what can i do?
Its http://chartink.com/ and not chartlink
hello can i ask qustions?
Bharat, you can ask your questions in comments.
Hi Shabbir,
I was curious to know how does a day look like for a day trader.I have finished reading your ebook and I think I am all set to start.
1. How do you pick stocks to start your day with.There are so many and day trading is all about picking the right stock at the right time.Things can change in minutes.
2. What tools and resources should a day trader keep in handy through out the trading session.
3. Do you have a specific list of stocks that you track religiously.
As always,thanks again for your ebook and advises.
Great Analysis Shabbir. I have already purchased ur book and its awesome.
Thanks for your wonderful feedback Soumya
Nice guide for me. I am not familiar with this stock information. I am new to this field. How you analysed it? I feel that, this is a difficult job.
Brilliant analysis!
How did you learn to do such brilliant analysis ? I’m not a finance guy hence I find this technical analysis stuff damn complicated…is there an easy way out ?
Btw I’m an electronics and telecommunications engineer, got into trading coz love the excitement that it offers…besides money 😛
Thanks for the wonderful feedback and it is the desire to learn things help me understand it. I am a B.Tech in IT.
I see you have written a book on Technical Analysis 🙂
Is this book enough for me to master technical analysis in a nut-shell ? Coz I am not looking for any complicated stuff, just something that works for me to read the daily graphs on Yahoo Finance and Google Finance….and take a confirmed call that works ?
I’m not much into Finance, except I love the excitement and profits of trading 😉 So will buying this book of yours give me a “short-cut” in a positive way to achieve nirvana in Technical analysis ? 😛
Thanks
Oh…me a B.E.(Elec & Telecomm), anyway two techies talking about bollinger bands and all 😛 Hmmm…bollinger name sounds good, though dunno what it means!
I hope we keep it to Technical Analysis and not move to only Tech. 😀
This book is good for people who have little time to dedicate to the market and still want to be getting informed decisions.
It is not shortcut way but a smarter way to know what works in the market.
And how easy is that ?
Does your book have all it takes to make me a Technical Analyst for my personal decisions ?
That’s what I think and if you purchase using Credit cards you have 30 day money back guarantee as well. See here